To diagnose common forwarder problems you can start by going to the Webservices -> Forwarders -> STATS tab.
This tab contains a lot of helpful information that you can use to determine the status of the remote endpoint.
Here’s a breakdown of the sections and their meaning:
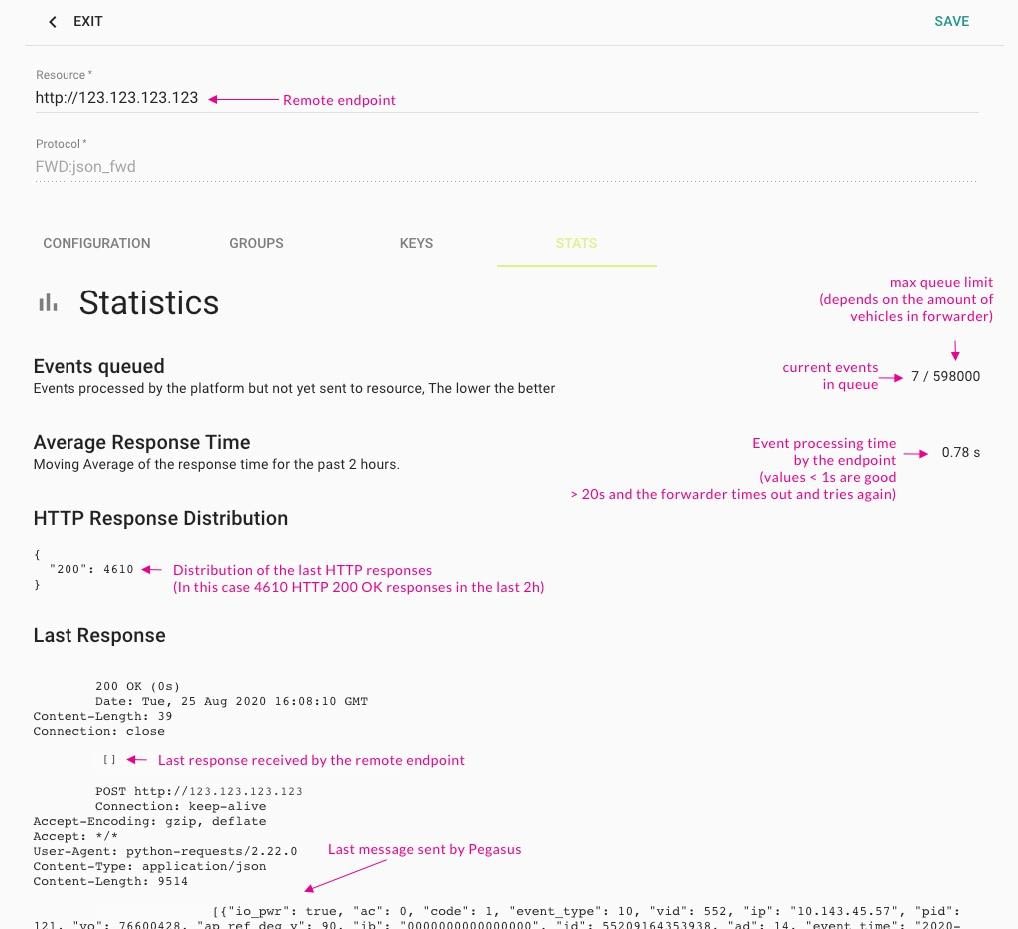
Besides the information above, if there’s a problem with the remote endpoint, you’ll see an Error banner with an error message.
The most common one being that Pegasus is unable to connect to the endpoint, the banner will show something with the words: Read timed out.
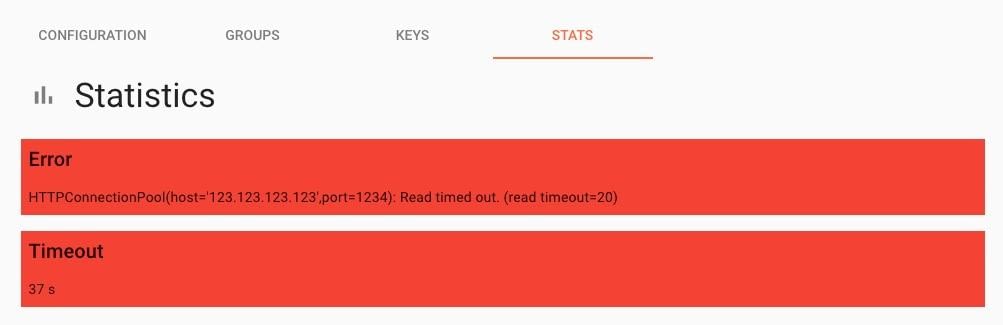
This has to be fixed on the remote endpoint’s end, to make sure that it’s up and Pegasus can connect to it.
Another common error is that the remote endpoint is taking too long to process the messages. Pegasus has a timeout of 20 seconds before it sends more data, this means that if the remote endpoint doesn’t respond in 20 seconds the queue will continue growing.
Under this scenario you’ll see some HTTP 408 under the HTTP Response Distribution, and a higher than normal Average Response Time.
You can always test the communication of an endpoint via an http post request, more info.
-
This topic was modified 5 years, 11 months ago by leo.

