
Quick Start
This is a quick start into using the Gateway effectively.
Common Terminology
- Gateway – used to refer to the actual tracking page, system or portal
- Device – electronic equipment that’s installed in cars primarily for fleet management
- Events – whenever the device pings the server or reports, it sends an ‘event’. This event generally has location info, but it can also include other info such as engine data or photos.
- Asset – an asset is generally referred to a person or individual that can be tracked and assigned to vehicles
- Vehicles – primary tracking unit that the platform monitors
- Entities – refers to any vehicles or assets
- Modules – used to refer to the mini applications inside the system, such as tracking, trips, alerts, etc
- Widgets – sections inside the modules with different functionalities
- Automation – the name of the module where notifications (triggers) are created
- Triggers – also known as alerts or notifications, they can use a combination of conditions and make many actions happen
- MDT – is a device mode where you can send text to the device directly via it’s communication port
- Taurus – mobile application that’s used to track the phone’s location
Home page
On the home page you can click on the forgot password link to send a password reset link to your email. You can also stay logged into the system by clicking on the Remember me button.
Once logged in you can change the preferences of your system by clicking on the person icon in the upper right hand corner and clicking Preferences.
Once you’ve set the preferences you will find the menu to the different apps on the upper left hand corner. If you don’t have access to any of the apps please contact your site administrator.
Tracking
The tracking module is used to monitor any number of vehicles or assets in real-time! It can provide insights on the operation of your fleet and give you the information you’re looking for fast.
Entity List
Views
List

- Access to the main menu.
- Last pending alert.
- Vehicle search and indicator of available vehicles after filtering
- Filter entities by groups.
- Filter entities within geofence.
- Add vehicles to tracking
- More filters
- Change view of indicators
- Sort by options
- Download list of entities
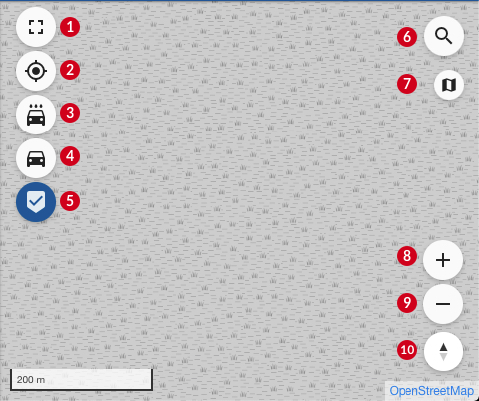
Map
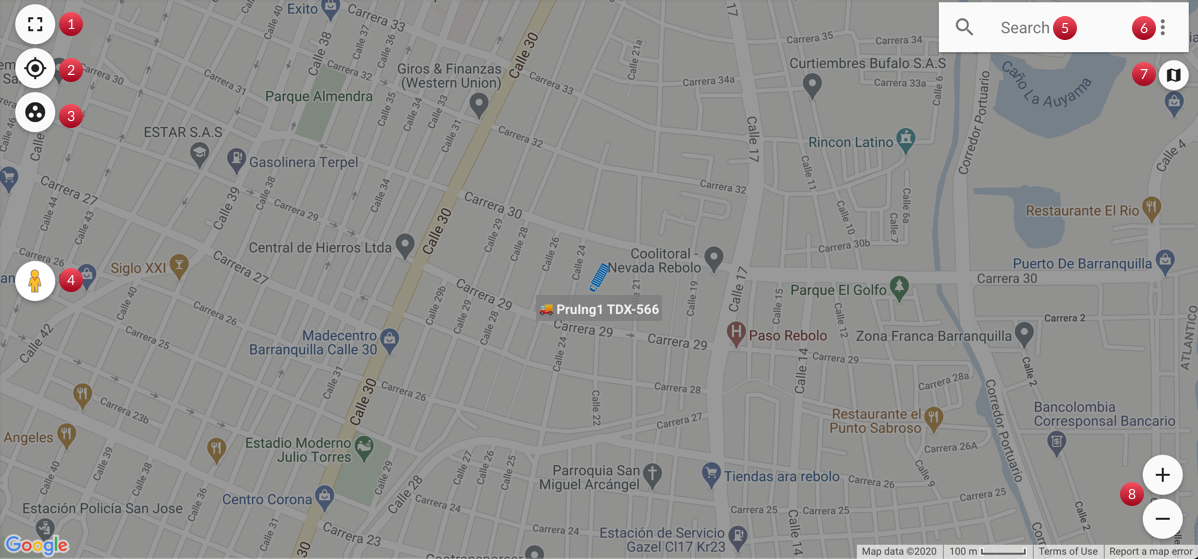
- Full screen option
- Center on all entities
- Group/Ungroup nearby entities
- Switch to street view (available on Google Maps map only, #7 allows you to switch maps)
- Search geofences or places on the map
- Geofences menu
- Map layer switcher
- Zoom in/out
Adding & Selecting our Entities
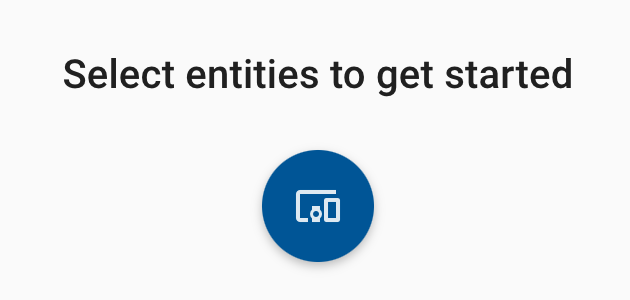
When you login for the first time, it is possible that the vehicle list is empty showing a message like the following:
click on the ![]() button, to open a group, asset and vehicle list.
button, to open a group, asset and vehicle list.
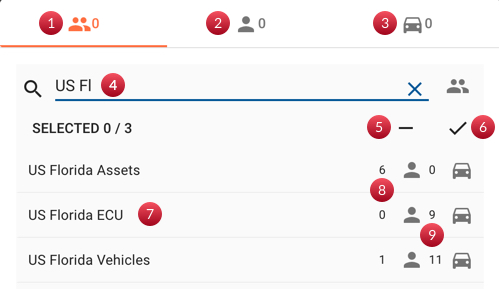
- Groups. It will add all the entities belonging to the group we select, to the tracking list
- Assets. It will add only the assets selected to the tracking list
- Vehicles. It will add only the vehicles to the tracking list
- Name filter
- Unselect list
- Select all from the filter
- Name of the group, asset or vehicle.
- Amount of assets in group
- Amount of vehicles in group
After selecting the entities you want to monitor click on the OK button to confirm the selection.
⚠️ Note: a max limit of 3000 entities are allowed to be tracked at any time.
You can click on the ![]() icon at the bottom left anytime to open the entities selector dialog.
icon at the bottom left anytime to open the entities selector dialog.
Once you have selected your entities the map will adjust to fit them all based on their last known location. The entities have the following icons to demonstrate their status
![]() – stationary or parked and it’s OFFLINE
– stationary or parked and it’s OFFLINE
![]() – stationary or parked and it’s ONLINE
– stationary or parked and it’s ONLINE
![]() – moving but it’s OFFLINE
– moving but it’s OFFLINE
![]() – moving and it’s ONLINE
– moving and it’s ONLINE
Although the devices tend to stay ONLINE the majority of the time, it is normal for them to go OFFLINE, this can happen for many reasons, but the most common are that there is little / no coverage in that location, or there’s network congestion in the area, or the device is entering it’s Low Energy Usage mode (Sleep Mode) momentarily, etc.
Filter Entities
Search, Group and Zone Filters
Pegasus offers multiple filters to find and select vehicles. These filters are of great help when managing your fleet.
![]() Search. With this filter we can write the name of the vehicle and all those that meet the characters we enter will be shown
Search. With this filter we can write the name of the vehicle and all those that meet the characters we enter will be shown
![]() Filter by groups. Pressing this filter will open a menu that allows us to select one or more groups. All the units that belong to these groups will be shown to us.
Filter by groups. Pressing this filter will open a menu that allows us to select one or more groups. All the units that belong to these groups will be shown to us.
![]() Filter by zones. Pressing this filter will open a menu that allows us to select one or more geofences. The vehicles that are currently within the selected geofences will be shown to us.
Filter by zones. Pressing this filter will open a menu that allows us to select one or more geofences. The vehicles that are currently within the selected geofences will be shown to us.
![]() Filter. This button displays a menu with more complex and varied filters with which we can group the units that have one or more characteristics. All the options available for this button are
Filter. This button displays a menu with more complex and varied filters with which we can group the units that have one or more characteristics. All the options available for this button are
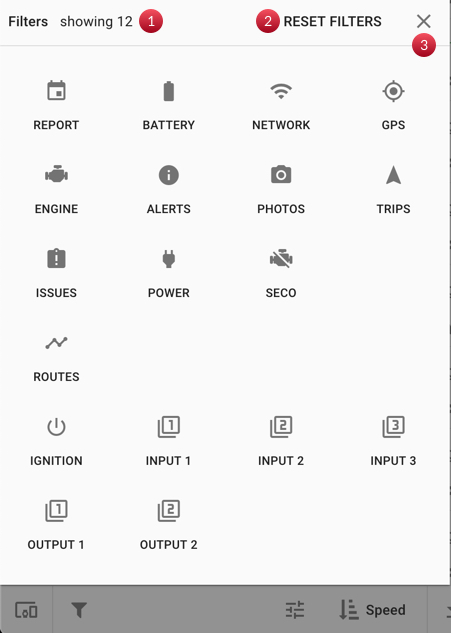
- Amount of vehicles displayed in the list
- Button to reset the filters
- Close the filters section
 | 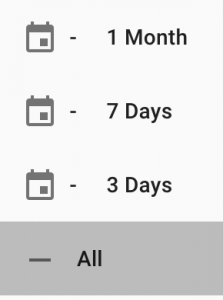 | The REPORT filter allows you to select the units that have reported their position to Pegasus in the last 3 days, last 7 days or last month. Selecting ALL will remove the filter and display all units. |
 | 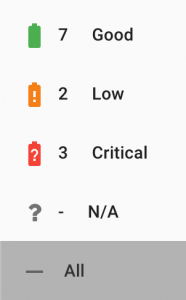 | The BATTERY filter allows you to select the units with the following battery states: Good, low, critical or unknown. Selecting ALL will remove the filter and show all the units. On one side of each option you can see the number of units that have the corresponding status. |
 | 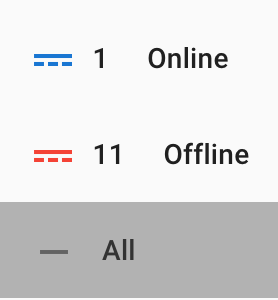 | The NETWORK filter allows you to view the units that are ONLINE or that are OFFLINE. Selecting ALL will remove the filter and display all units. On one side of each option you can see the number of units that have the corresponding status. |
 | 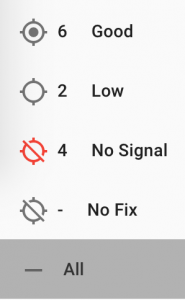 | The GPS Filter allows us to select the equipment with the GPS quality that interests us. Selecting ALL will remove the filter and display all units. On one side of each option you can see the number of units that have the corresponding status. |
 | 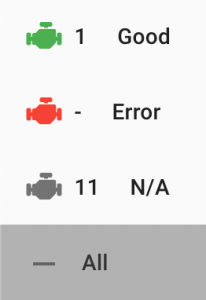 | With the ENGINE filter we select the units that have faults reported by the ECU monitor. Selecting ALL will remove the filter and display all units. On one side of each option you can see the number of units that have the corresponding status. |
 | 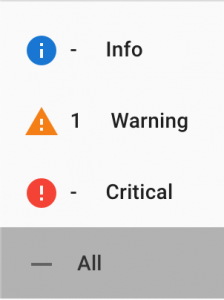 | ALERTS shows us the units with the type of alert that we select. Selecting ALL will remove the filter and display all units. On one side of each option you can see the number of units that have the corresponding status. |
 | 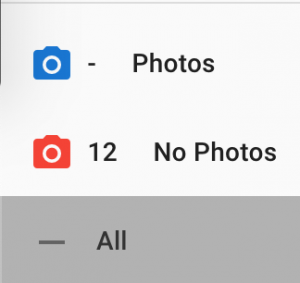 | PHOTOS allows you to select between vehicles WITHOUT photos and vehicles that have recently taken photos. Selecting ALL will remove the filter and display all units. On one side of each option you can see the number of units that have the corresponding status. |
 | 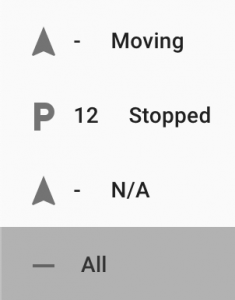 | TRIPS allows you to select the units according to the TRAVEL status they present. Selecting ALL will remove the filter and display all units. On one side of each option you can see the number of units that have the corresponding status. |
 | 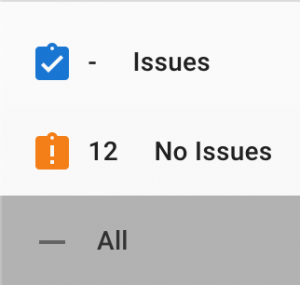 | The ISSUES filter shows any vehicles that have an issue that may hinder the device’s performance. For example, low battery, disconnection, no GPS, long time without reporting, etc. Use this for diagnostic purposes to view entities in your fleet that may need maintance. |
 | 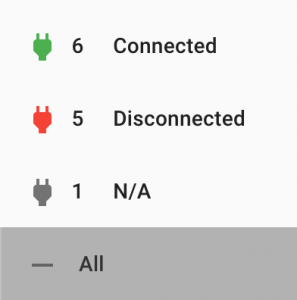 | The POWER filter shows the state of the power connection of any device. Note that this refers to the physical power to the tracking device connected. If it’s disconnected it may need a physical revision. |
 | 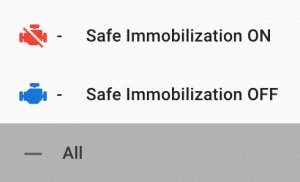 | The SECO filter shows the status of the Safe Immobilization of your fleet, whether it’s activated or deactivated for any vehicle. |
 | 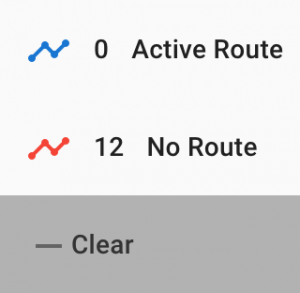 | The ROUTES filter shows the status of any routes that your fleet is performing. It can be used with the Routes view to verify the status of vehicles in a route. |
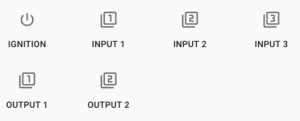 | The IGNITION/INPUT/OUTPUT filters allow you to filter based on the state of the physical status of a device’s inputs/output cables. |
Note that you can combine the filters too, so for example you could see a list of all entities with No Power, No GPS, and are Offline all at the same time.
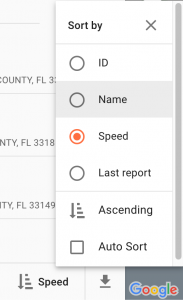
Sort
Clicking on the ![]() icon brings up a list of possible sorting options for the list of entities. In the following image we can see the available parameters with which to Sort.
icon brings up a list of possible sorting options for the list of entities. In the following image we can see the available parameters with which to Sort.
View Indicators
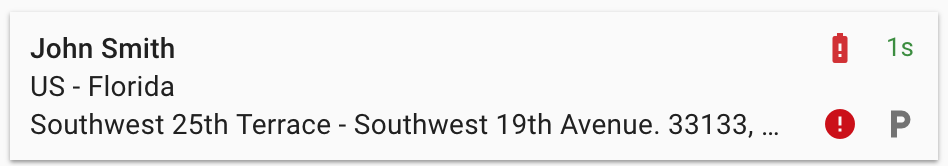
Using the ![]() icon along the bottom, you can switch from 4 views that will show you different information about your entities. In all 4 views you will see the name of the Entity on the top left, if that entity is inside a geofence underneath, and the last known address of that entity underneath that. You can switch from:
icon along the bottom, you can switch from 4 views that will show you different information about your entities. In all 4 views you will see the name of the Entity on the top left, if that entity is inside a geofence underneath, and the last known address of that entity underneath that. You can switch from:
- Zen / Minimalistic – shows the state of the entity, and it’s last communication, the goal of this view is to keep the content minimal so any icon signifies a critical warning or something that needs attention. Hover over the icons for more information.
- Location Info – this shows you ignition state as well as the current location related information of your entity, including the current speed they’re traveling at, how long it’s been moving or parked, and the quality of the GPS information.
![]()
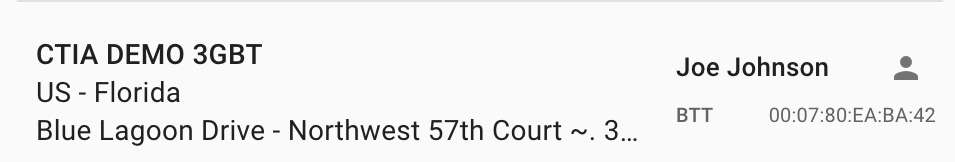
- Asset – this view shows any asset or vehicle that is associated to the entity. So for example if you linked your Taurus App to a vehicle the driver would show in this view. The asset can also come from a valid iButton identification, RFID tag, Bluetooth Tag, or Fingerprint ID.
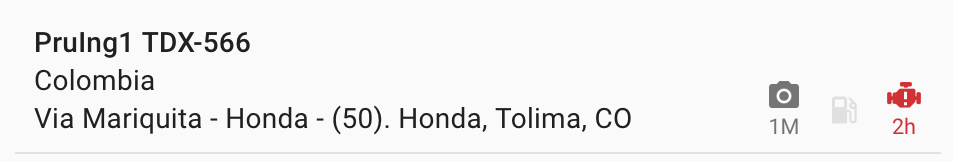
- IOs & Accessory – this view shows the status of your entity’s inputs & outputs, as well as the other accessory information. Works with Photos, Fuel Sensor, ECU monitor, Temperature Sensor & more.
You can sort by clicking on the ![]() icon, this will bring up a selector where you can choose to sort ascending / descending and to update automatically. You can sort by time, trip state, online, name, and speed.
icon, this will bring up a selector where you can choose to sort ascending / descending and to update automatically. You can sort by time, trip state, online, name, and speed.
Navigating the Map
There are icons on the map that help you with the navigation of your entities. You can click on the ![]() icon to ungroup entities that are too close together. You can click click on
icon to ungroup entities that are too close together. You can click click on ![]() icon to fit the view of the currently filtered list of vehicles. The
icon to fit the view of the currently filtered list of vehicles. The ![]() icon is used to make the map full screen. On the bottom right there’s buttons to zoom in and out of the map.
icon is used to make the map full screen. On the bottom right there’s buttons to zoom in and out of the map.
Address & Geofence Lookups
The search on the upper right hand side is used to find an address or a geofence, there’s a line separator that divides both sections.
Exploration Mode & Nearby
Clicking on the ![]() icon next to the Search will show you more options, one of these is the exploration mode. Exploration mode can be used to find an address on the map and the entities that are near it. Activate the mode by clicking on the
icon next to the Search will show you more options, one of these is the exploration mode. Exploration mode can be used to find an address on the map and the entities that are near it. Activate the mode by clicking on the ![]() icon and click anywhere on the map, on the dialog you can then click on the
icon and click anywhere on the map, on the dialog you can then click on the ![]() icon to search for entities within 10km of that point.
icon to search for entities within 10km of that point.
Changing the Map Type
You can change the map provider to others such as: Open Street Maps, Mapbox, or Google Maps (note that admins have to enable the Mapbox & GoogleMaps) . To change the map type click on the more menu ![]() and go to the settings
and go to the settings ![]() icon. Select the map type you’d like and save your results by clicking on the
icon. Select the map type you’d like and save your results by clicking on the ![]() icon. Note that this changes the map of the other modules like Trips & Geofences.
icon. Note that this changes the map of the other modules like Trips & Geofences.
Vehicle Cards
Entity Dashboard & Cards
To access a greater amount of information about a particular entity, you just have to double click on it from the list, this brings you to the dashboard view. In the dashboard there are different sections (we sometimes call cards) that will give you information on the last known status of that entity.
Main Dashboard Cards:
- F
- Alerts – view the unattended alerts for this entity.
- Pin Drop / Safe Zone – manage a virtual fence around the entity, and be informed when the entity leaves.
- Live Info and Events – view the last reported events.
- Trip History – view a history of where the entity has been in the last 3 days.
- Current Cycle – view information related to the current segment of the vehicle.
- Asset/Vehicle – view any currently assigned entity such as the information of the vehicle or asset.
- Photos – see the last photo captured and its location & time.
- Features – manipulate the devices’ features such as the Safe Engine Immobilization or activate a different output.
- Sensors & Inputs – view the state of any connected inputs & sensors.
- Metrics – see information relevant to the odometer or total engine on time.
Submenus/Widgets Information:
Different widgets or sections can be accessed from the ![]() icon on the top right next to the online state, it contains:
icon on the top right next to the online state, it contains:
- Details – view the entity’s details and it’s properties
- ECU Data – shows vehicle data from the vehicle’s onboard computer, as well as the TPMS information (requires an accessory)
- Chat – if you have an asset selected you can chat with that asset directly
- MDT – if you have a vehicle selected you can send messages to the device that’s connected to it (note that these messages are not device commands)
- Connectivity – It shows us relevant information regarding the connectivity of our tracking equipment with Pegasus as well as the status of the GPS and the SIM card
- Device console – It allows us to send commands directly to the device and observe the history of sent commands (this requires special permission).
Main Dashboard
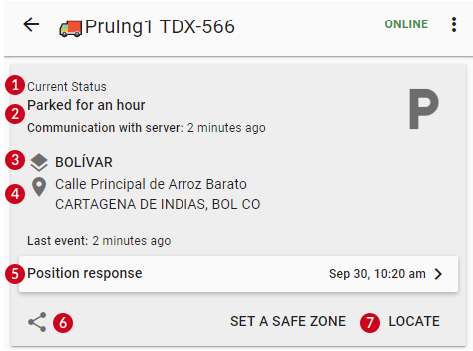
The structure of the cards on the main dashboards following the pattern above:
- Name of the card
- Current status / most relevant information
- Geofence where it occurred
- Address
- Main content (events for live, or photos)
- Secondary action button
- Primary action buttons
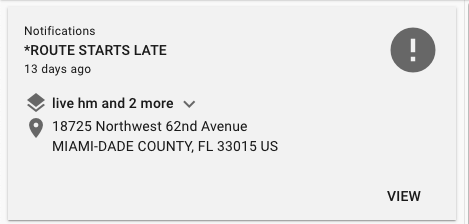
Notifications
The notifications card shows the last unattended alert. Note that it shows the most important alert first, in other words critical > warning > info, thus you’ll always see a critical alert first until it’s attended. To attend the alert just click on the VIEW button.
Current Status
Shows the last generated status of the entity, including the status of it’s current trip and the last time it connected.
It’s important to distinct here the last communication vs the last event. Events are reported when an important condition occurs on the device, such as a button pressed, speeding detected, or ignition was turned ON. However, in the background the device is constantly attempting to maintain it’s connection to the system, so during a period of no events a message is transmitted from the device to the system to maintain the connection. Thus it’s normal to see a last communication with a more recent time than a last event.
You can click on the name of the event generated (5 above) to obtain a list of the most recent events.
The primary actions are for updating the location of the vehicle, and setting a safe zone (more information below). The secondary actions is a menu to share the location of the vehicle, or use it for navigating purposes.

Safe Zone
The safe zone is a feature that creates a virtual fence or perimeter around your entity and can notify you via email the next time that perimeter is breached. It can also perform automatic actions when the fence is breached, such as activating the Safe vehicle Immobilization feature.
On the map, you can tell when a vehicle has violated its safe zone because the icon will change to red and pulsate.
Trip
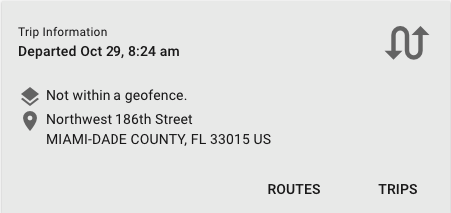
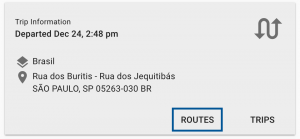
Trip Information
Shows the last trip status including the time and date of departure. Note that if the entity is stationary this card may not be present. This section can also show the current status of a route if it’s programmed.
ROUTES – Viewing the Routes
The routes view shows you the vehicle’s active route, please note that routes appear 2 hours before the scheduled start time, and up to 4 hours after the time of arrival at the destination, unless there’s another route scheduled before this, in which case it shows the next route.
Routes can have as many checkpoints as you want, and in tracking you can keep track of the routes completion by seeing the scheduled time of arrival and whether or not they’re on time or have missed their next checkpoint.
TRIPS – Viewing the History
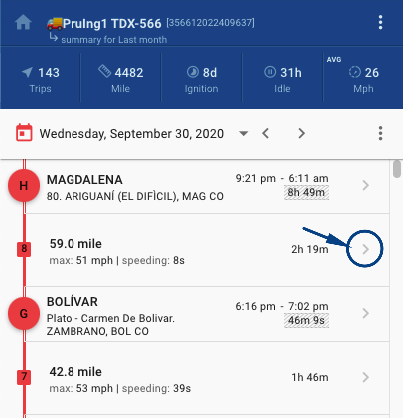
The history view inside of tracking is meant to show you the last 3 days worth of trips quickly. When you click on history you will see an overview of the last trips the entity performed. Clicking on the trip will show you it’s path on the map, you can click on the right icon ![]() to get more details on that particular trip. Click on the back arrow to go back to the list of trips.
to get more details on that particular trip. Click on the back arrow to go back to the list of trips.
Just like in the vehicle list, you can switch the information that’s shown in the list of trips by clicking on the switch icon on the bottom ![]() . Some of the information that’s shown includes the max speed for the trip, as well as the amount of time spent over the speed limit, the time spent in idle, or the amount of fuel consumed.
. Some of the information that’s shown includes the max speed for the trip, as well as the amount of time spent over the speed limit, the time spent in idle, or the amount of fuel consumed.
From the list of trips you can also only view the stops that were made or both the trips and stops using the ![]()
![]() icons along the bottom.
icons along the bottom.
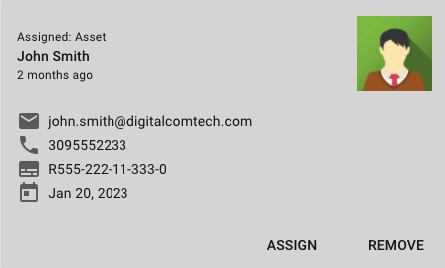
Driver Info & Assignment
The driver card shows the currently assigned driver, this driver can be manually assigned or automatically via any of the following ways: iButton, RFID, Taurus, or Bluetooth Tag.
You can change the assignment of a driver manually at any time by clicking on the ASSIGN button. You can also click on the REMOVE button anytime to remove that driver.
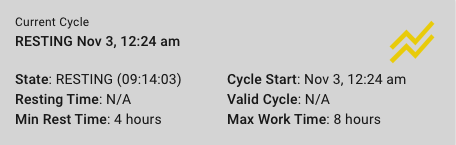
Current Cycle
The current cycle card shows information related to the current segment of the vehicle. For example, it shows when the entity begins to work or when begins to rest, the amount of hours that the entity has been working or resting, if the entity is overworked, etc. For more explanation visit the Hours of Service Section.
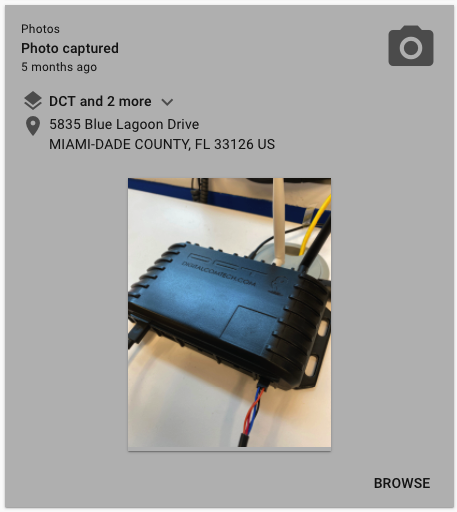
Photos
There’s a card for viewing the last photo captured with the Taurus app or the Photocam accessory, you can also browse a list of previous photos taken. If you use the camera accessory you will find a CAPTURE button.
Note that once a photo is captured it takes some time, a couple of seconds up to a minute depending on the network connections.
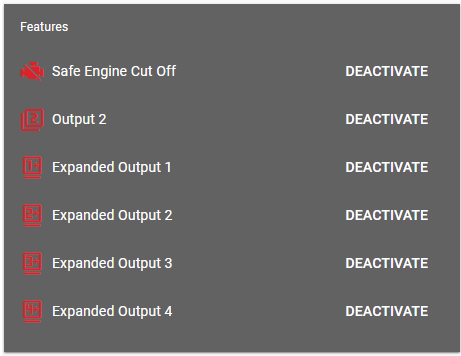
Features
Depending on which device and accessory you have installed, you’ll see a list of features or outputs that are enabled in this section. These outputs can be turned ON/OFF remotely with this section.
Activating the Outputs
One of the important outputs From the dashboard we can activate or deactivate the Safe Engine Immobilization by clicking on the button on the right of the icon. (Please note that Safe Engine Immobilization is a feature that has to be previously installed by a professional inside your vehicle).
![]() – regular normal state, the vehicle’s starter or ignition is operating normally.
– regular normal state, the vehicle’s starter or ignition is operating normally.
![]() – engine is immobilized, the ignition switch will not work until the system deactivates the immobilization.
– engine is immobilized, the ignition switch will not work until the system deactivates the immobilization.
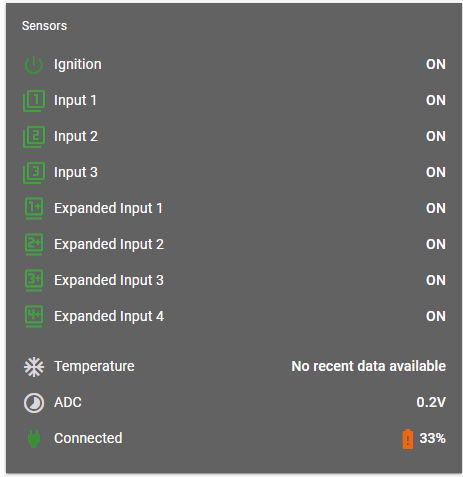
Sensors
The sensors section shows an overview of the state of the last connected sensors to the device. The sensors can include any input sensor, like to know if a door is closed, or if something’s activated.
Temperature data is available as long as you have the necessary accessory. Here you’ll be shown the last temperature reported.
ADC is a voltage value that comes from a cable called an ADC cable on the device. It converts any analog value that’s sensing between 0-10V and reports it here.
The connected state refers to the external power connection for the device, and the battery refers to the devices internal battery.
Next will describe it de different icons of the battery
| Icon | Description |
| The battery status never detected | |
| The battery state is detected but disconnected or 0V | |
| The battery percent is between 95% and 100% | |
| The battery percent is between 60% and 94% | |
| The battery is charging and the percent is between 60% and 95% | |
| The battery percent is between 20% and 60% | |
| The battery is charging and the percent is between 20% and 60% | |
| The battery percent is between 0% and 20% | |
| The battery is charging and the percent is between 0% and 20% |
Submenus/Widgets
Vehicle Details
Under the ![]() menu you will see the Details section, where we can find all the information relevant to the entity and the device associated with it. From top to bottom we find:
menu you will see the Details section, where we can find all the information relevant to the entity and the device associated with it. From top to bottom we find:
- Photo of the vehicle (In case of having it added).
- QR code to associate with the Taurus tracker APP.
- Description of the vehicle (plates, tank size, brand, etc).
- Properties. Extra information we have added.
- Device. Tracking equipment associated with the vehicle, its managed configuration, firmware version.
- SIM. Data of the SIM Card that the tracking equipment has
- Driver. If associated, it shows the driver’s data.
ECU or Engine Data
If the device has a compatible accessory installed, we will be able to see the information that it extracts from the vehicle’s computer. Among the parameters detected by the ECU we can highlight fuel level, hour meter, odometer and tire pressure.
Chat/MDT
The chat is enabled for entities that are using the Taurus app, it allows for you to chat with the application.
If the entity has an MDT type screen or some serial communication accessory installed. We can see in this section the data that the accessory sends to the Syrus as well as the messages that we have sent.
Connectivity
It shows us relevant information regarding the connectivity of our tracking equipment with Pegasus as well as the status of the GPS and the SIM card.
Device Console
It allows us to send commands directly to the connected device and observe the history of sent commands.
Map
- Full Screen/Exit Full screen. Expand the MAP in all the screen.
- Fit All. zoom out/in the map until all your vehicles are shown in the map.
- Show fleet. This button will show the rest of the vehicles on the map.
- Focus. This button will focus the view on the specific vehicle.
- Follow. This button will follow the entity on the map as it moves.
- Search. Allows you to search for places/addresses or geofences.
- Main Search Menu
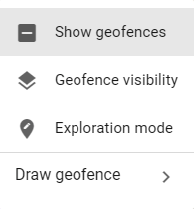
- Show geofences. Show all the selected geofences.
- Geofence visibility. Select which geofences will be seeing.
- Exploration mode. Selecting this option allows you to click in any part of the map and see which geofence is there.
- Draw geofence. Allows you to create a geofence.
- Main Search Menu
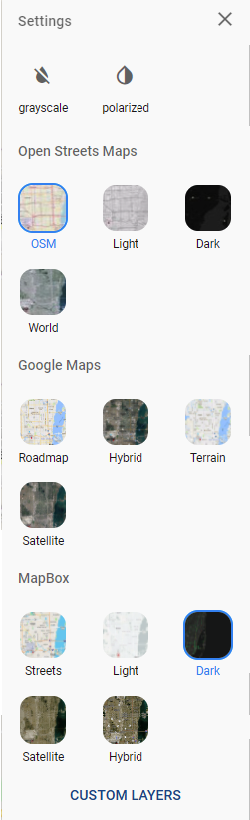
- Map Settings. Change the map.
- Grayscale. Shows the map in Grayscale.
- Polarized. Lower the brightness of the map.
- List of maps to select.
- Custom Maps are for adding a new map layer.
- Zoom in.
- Zoom out.
- Compass. Allows you to rotate the map, and by clicking on it will bring it back to true North.
Main Search Menu
Map Settings
Hours of Service
The main idea of the Hours of Service feature is to control and manage the entity’s work hours, breaks, and rest periods. To achieve this, each entity can have a work cycle that corresponds to its daily work schedule.
A cycle usually includes two segments: one working segment and one resting segment. A cycle starts with a working segment, that will be automatically closed when the vehicle meets the minimum resting time. When the cycle is invalid the segment can also be closed manually.
Note, that when we refer to “close the cycle”, it means that the current segment will be completed/closed, the closed segment will be saved on the database, and a new current segment will be created when the next event is received.
To see the Current Cycle of a particular entity, once you filter the entity double-click on it, this brings you to the dashboard view. In the dashboard, there are different sections (we sometimes call cards) that will give you information on the last known status of that entity. The Current Cycle card shows information related to the current segment.
In this example, the device associated with this vehicle has the segment configured with the moving signal.
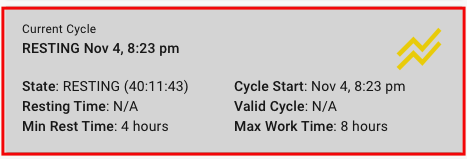
Working cycle without resting time
In this example, the current cycle is in a working state, which means that the vehicle is currently in a working segment and is constantly moving.
![]()
- State: can be “Working” or “Resting”. In this example, the vehicle is currently in a working segment, and it has been working for 5:26:33 hours.
- Resting Time: how long the entity has been taking a rest period during the working segment. In this example, N/A the vehicle is not taking a break or rest period. The vehicle is constantly moving.
- Min Rest Time: minimum hours that the entity must continuously rest to automatically create a resting segment. In this case, the vehicle needs to rest at least for 4 hours to consider the creation of a resting segment. When the vehicle stops for at least 4 hours, at the next received event the working segment will automatically end and it will be created a resting segment.
- Cycle Start: show the date when the vehicle starts the cycle. In this case, the signal configured is moving, so the vehicle is considered working when its speed is greater than 3 mph.
- Valid Cycle: show an icon that refers to whether the cycle is valid or not. If the entity is overworked the cycle will be invalid.
- Valid
 and Not Valid
- Valid
- Max Work Time: maximum hours that the entity can work during its cycle. The entity will be overworked if it works for more than this time, and its cycle will be invalid. For example, if the Max Work Time is 8 hours, the entity will be overworked when it works for more than 8 hours, and therefore the cycle will be invalid.
Working cycle with resting time
In this example, the vehicle is still working but it stopped 5 seconds ago and continues without moving. The Resting Time shows the time the vehicle is stopped, and the icon on the top right of the card refers to this stop.
![]()
Resting cycle
When the entity remains without moving (in this case, the signal is moving) for at least the Min Rest Time, the working segment is automatically closed and creates a new resting segment.
Manually close an overworked cycle when the device is online
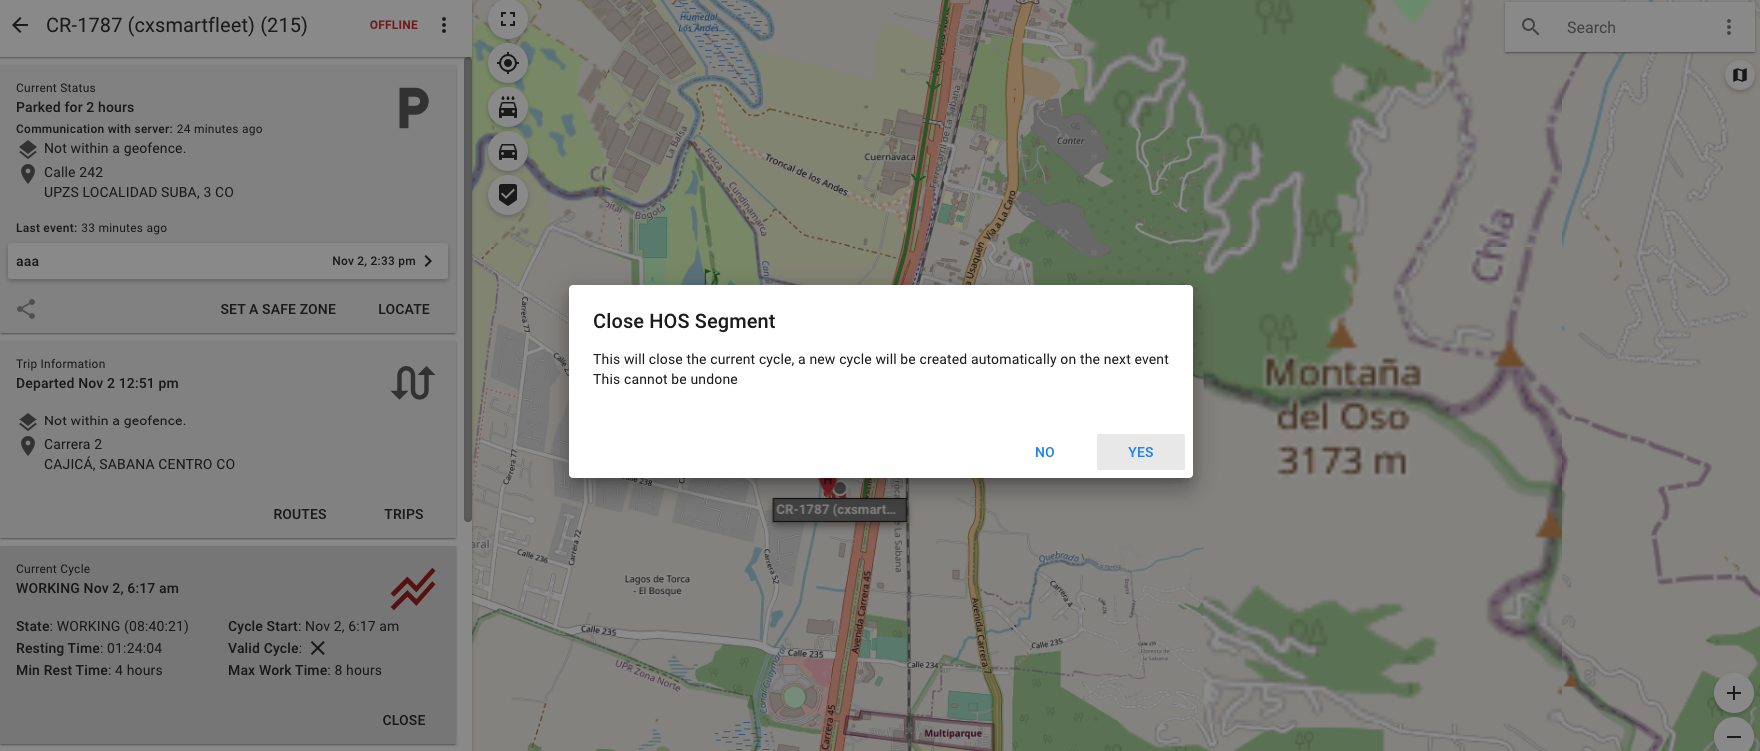
When the vehicle works for more than the Max Work Time, the cycle will be invalid. In this case, the cycle can be manually closed by clicking on the CLOSE button. Only invalid cycles can be closed manually.
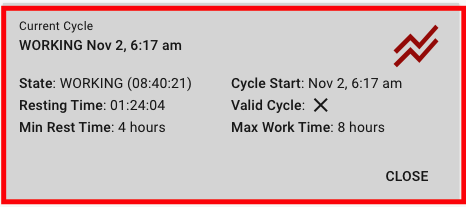
When you click on the CLOSE button shown in the image above, will show a confirmation dialog informing you that the current cycle will be closed and a new segment will be created automatically on the next event. If the next event does not detect any motion, a new resting segment will be created because it means that the vehicle is stopped; otherwise, if the next event received is a motion (in this case the signal is moving), a new working cycle will be created.
Manually close an overworked cycle when the device is offline
When the device is offline and the cycle is closed manually, the current cycle will be displayed with a resting state. When the device comes back online, Pegasus will update all previous segments and cycles corresponding to all received events.
Cycle status
The cycle status is shown as an icon on the top right corner of the Current Cycle card. You can also filter by the cycle status in case you are looking for cycles with a specific status.
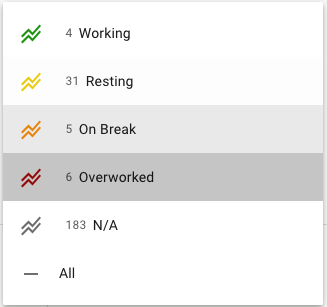
Meaning of the icons:
- Working: the entity is working, so the current cycle is in a working segment.
- On break: the vehicle starts a break when stops or turns off (depending on the configured signal). At this moment, the cycle is still working and the vehicle has not been resting for more than the minimum resting time.
- Resting: the current cycle is in a resting segment. At this point, the current cycle has a completed working segment and is in a current resting segment.
- Overworked: the vehicle is overworked when works continuously without breaks for more than the Maximum Continuous Working Time (configured in the setup segment by the Admin) or works for more than Max Work Time.
- N/A: the device does not have the segments configured.
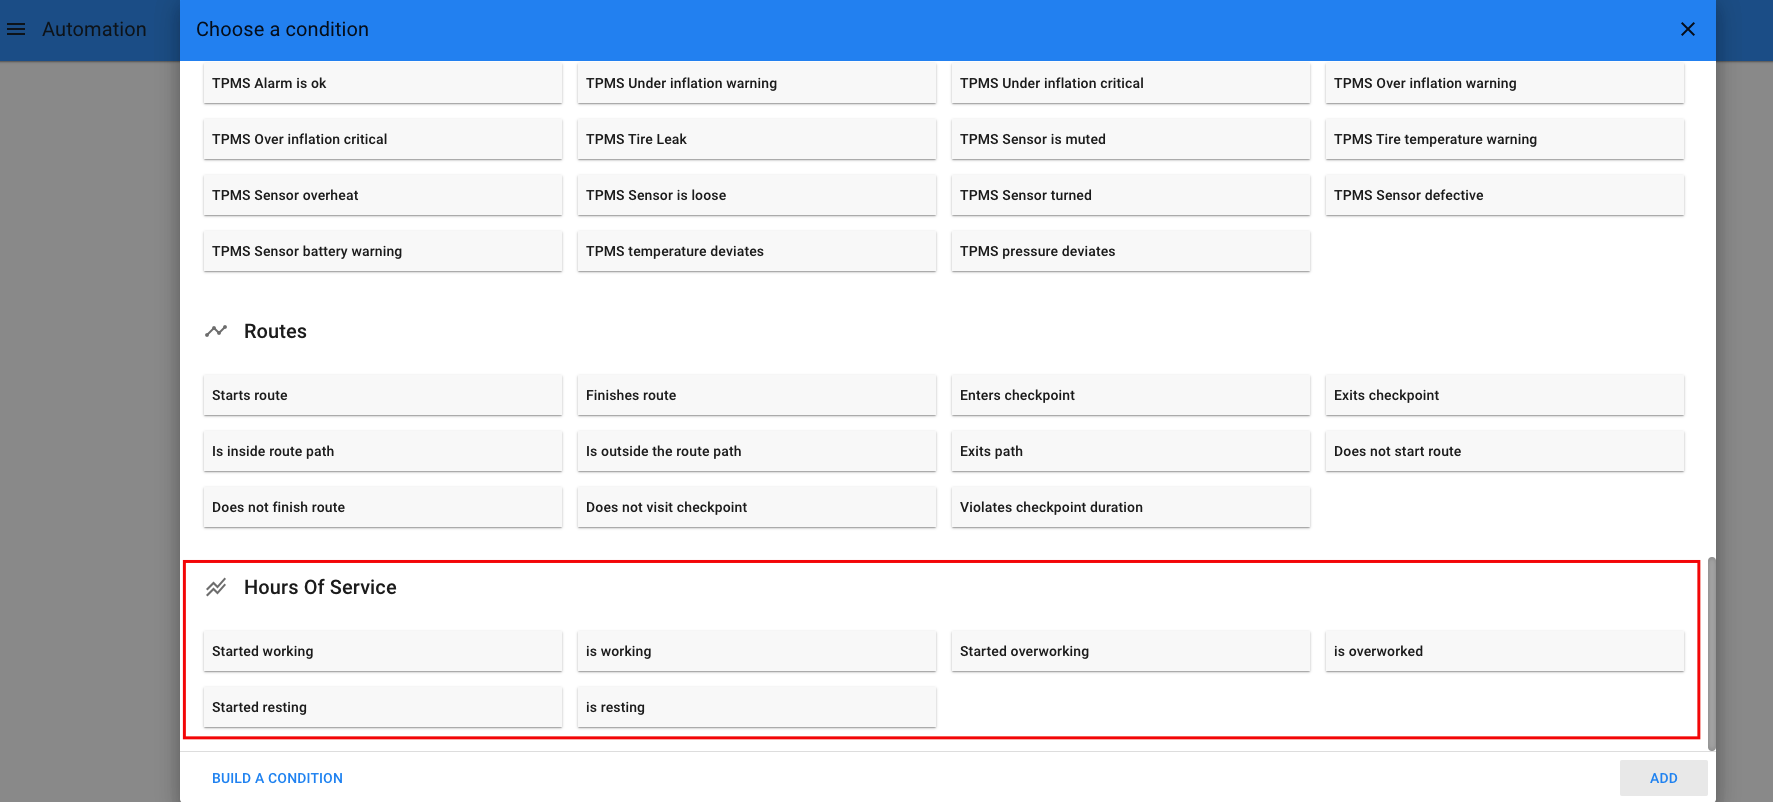
Associated triggers to HoS
You can create triggers associated with Hours of Service, to receive specific actions when selected conditions are met. For more information about how to create triggers, consult Automation
Trips
The trips module is used to get a historical view of the trips that your entities have made at any time in the past.
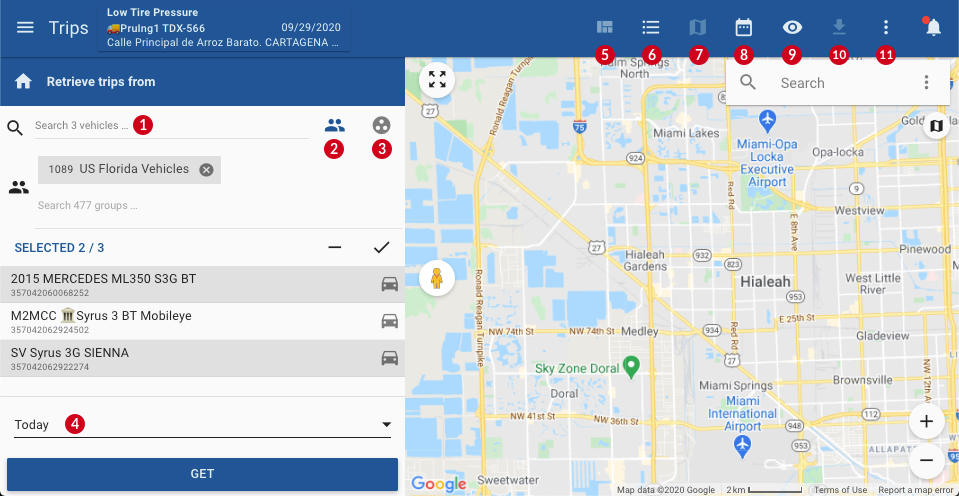
- Search for an entity
- Filter the list of entities by group
- Filter the list of entities by type of device
- Date range
- Change layout
- Hide/show the list
- Hide/show the map
- Hide/show the calendar
- Toggle peek mode, when active it shows the trip start/end locations when you hover over the trip
- More settings for the application
To get started simply select one or many entities from the selector, and a date range. Then, click on the button “GET” to retrieve the trips.
Browsing
The list of trips can be changed to show only ![]() trips or
trips or ![]() stops or both. To do so simply click on the icons along the bottom to switch between views.
stops or both. To do so simply click on the icons along the bottom to switch between views.
You can also select a different metric to view for every trip by clicking the ![]() icon.
icon.
For every trip, besides the distance and duration, there is a possibility for the metrics to include:
- Speeding (max & time spent over speed)
- Idling (time & percentage)
- Acceleration (most aggressive acceleration/deceleration)
- Driver name
- Fuel consumed / wasted (consumed while idling)
Depending on how many days you selected you’ll be able to scroll left and right through those days and quickly see where the vehicle was that day.
- Go back a day
- Go forward a day
- Controls for the day
- Controls for all days
Controls
The ![]() next to the date can be used to draw in the map all the paths and stop markers for the selected day.
next to the date can be used to draw in the map all the paths and stop markers for the selected day.
The ![]() next to the name of the entity can be used to draw the paths of all the trips in all the days selected.
next to the name of the entity can be used to draw the paths of all the trips in all the days selected.
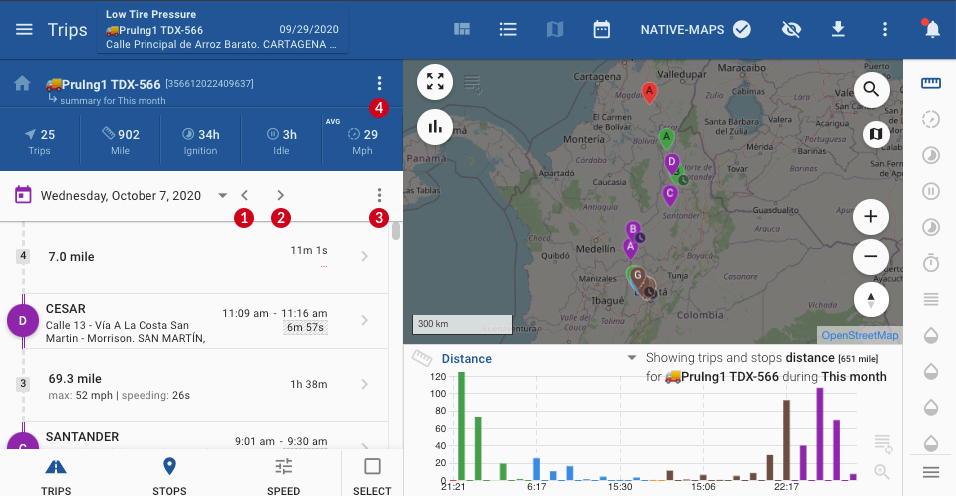
Trips summary
The summary of the trips list can give you a quick look at the totals for the selected time range. You can expand the list by clicking over the summary and this will give you all the available metrics, and you can closing clicking in the![]() icon. With the summary expanded you can see one switch button to hide the undefined fields.
icon. With the summary expanded you can see one switch button to hide the undefined fields.
Tip: you can select your most important metrics from the list by clicking on the star to favorite them. Up to 5 items can be favorited at a time.
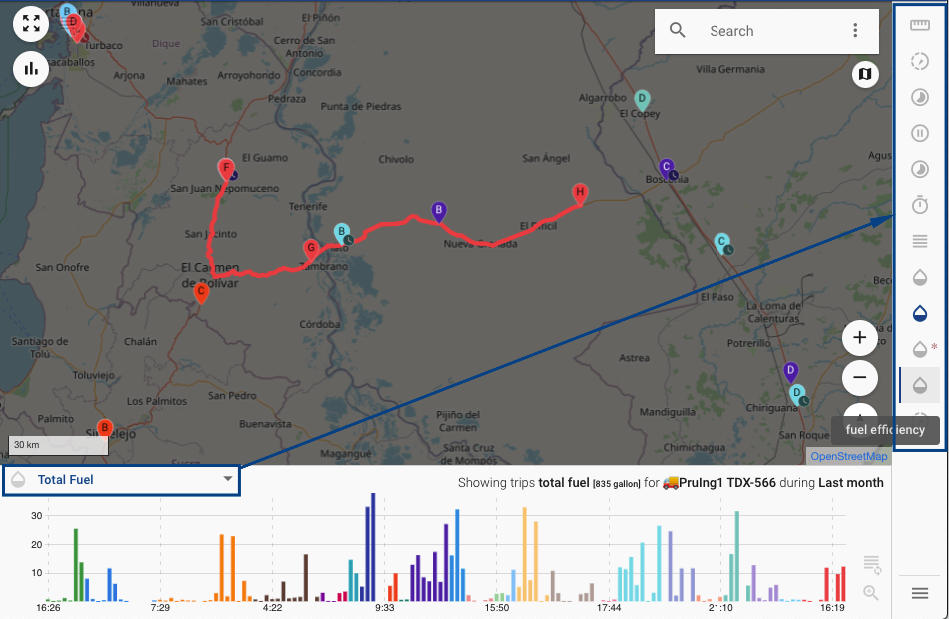
Map
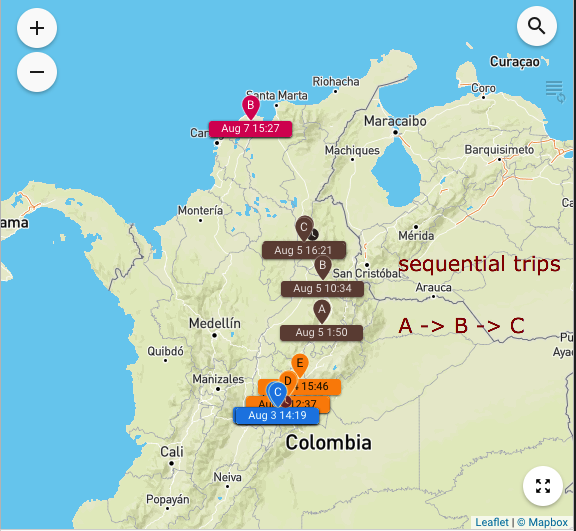
The map shows the paths and a pin marker with a letter that represents the stops the entity made.
These markers and paths can be different colors depending on whether only one day is being viewed, then every trip is a different color. If there’s multiple days selected then there’s a different color per day.
Keep in mind that the stop markers have letters of the alphabet that are in chronological order according to where they were first.
So for example in the view below we can see that the vehicle traveled on August 5 from A->B->C which happened on a trip going north.
Calendar
The calendar can be pulled up at any time, just by clicking on an entity and clicking on the ![]() icon next to the date range or from the toolbar.
icon next to the date range or from the toolbar.
Calendar shows you a daily summary of the metric selected. You can select different metrics and the calendar will update accordingly.

- Month selector
- Go back 1 month
- Go back to current month
- Go forward 1 month
- Show/hide totals for the month or date range selected
- Change metrics
Trip Details (Events view)
You can view the details of the events reported for each trip by clicking on the ![]() icon from the list.
icon from the list.
Once the details are shown you can color each dot on the map by clicking on the ![]() icon on the map.
icon on the map.
- Color by day – (default) colors the dots by day, each day will have a different color.
- Color by label – colors the dots by event reported, each event will have a different color.
- Color by value/range – colors the dots by the actual value it represents, for example with speed metrics you can see a different color the higher the speed is.
- Heatmap (density) – colors the dots by the value and proximity of the dots around it.
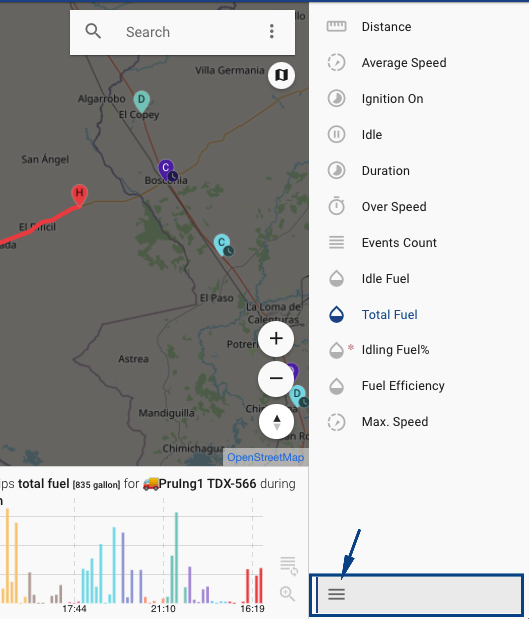
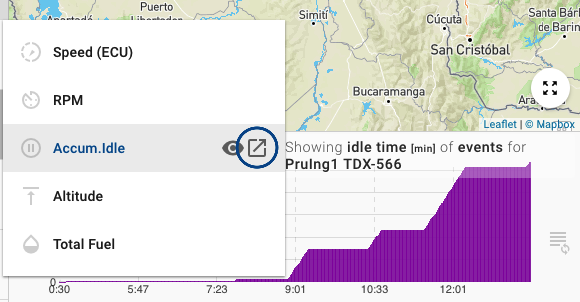
Graphs
The graphs along the bottom of the trips synchronize with the data that you view on the map. In other words you can navigate the different metrics and click on them and they will load the corresponding trips.
You can also change the metrics with the list of icons on the right hand side of the page.
You can also click on the icon on the bottom right to view the description of each metric.
Graphs can also be hidden with the ![]() icon on the map:
icon on the map:
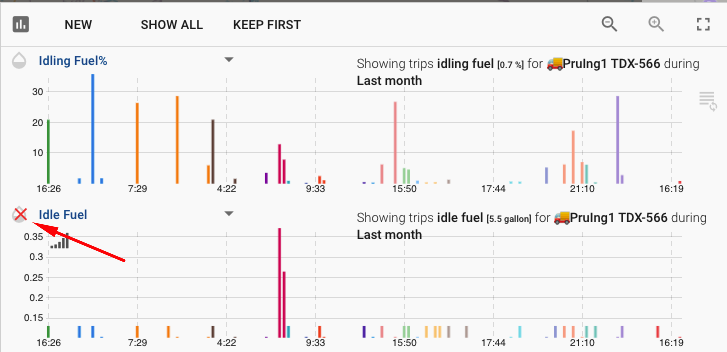
Stacking graphs
You can stack the metrics graphs by clicking on the ![]() icon from the dropdown menu list on the graph.
icon from the dropdown menu list on the graph.
Once the graphs are stacked, you’ll have the following options to choose from.

- NEW – adds a new graph to the list
- SHOW ALL – displays all the metrics available
- KEEP FIRST – goes back to normal, single 1 chart view.
 – Zoom out, which makes the graphs smaller
 – Zoom in, which makes the graphs larger
 – makes the graph area full screen
here’s what it looks like to zoom out and go full screen.

And if you want to close a graph only need to put the cursor over the icon who is to the left of the name and it’s gonna appear a red X click on this and the graph will disappear.
Heatmaps
Heatmaps can be enabled by going to the detailed view of a trip and clicking the ![]() icon in the toolbar. This will show you with shades of colors (lowest) light blue -> green -> yellow -> orange -> red (highest) a representation of the metric selected on the bottom chart. In other words if the altitude parameter is selected, it will show you in red where the highest altitude was, and in light blue where the lowest altitude was.
icon in the toolbar. This will show you with shades of colors (lowest) light blue -> green -> yellow -> orange -> red (highest) a representation of the metric selected on the bottom chart. In other words if the altitude parameter is selected, it will show you in red where the highest altitude was, and in light blue where the lowest altitude was.
Tips: For maximum visibility you’ll want to remove the trip path, you can do this by clicking on the number of the trip, you may also consider changing the map to a black and white version.
You can modify the radius of the dots and see this option better. You can also customize the range of the metrics, in this case the speed.
Export Trips
With this option you can export the trips, stops or both by clicking on the checkbox next to the ![]() and select the trips or stops that you want.
and select the trips or stops that you want.
Another option is to use the ![]() icon that appears on the left, to show a checkbox where you can select all the trips or stops.
icon that appears on the left, to show a checkbox where you can select all the trips or stops.
You can export as a KML file or create a route from the trips selected.
Routes
The routes feature allows you to schedule a route for an entity, with multiple checkpoints or locations that the driver is supposed to visit, with a time for each checkpoint.
When creating the route the time and duration fields are optional, but they’re useful for the Route reports.
Creating a Route
Routes are created from the Tracking application, click on any entity to go to the Dashboard, then from the Trip Information card, click on ROUTES.
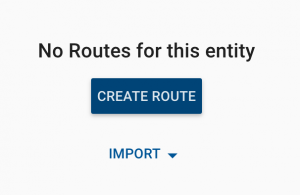
Click on the CREATE ROUTE button.
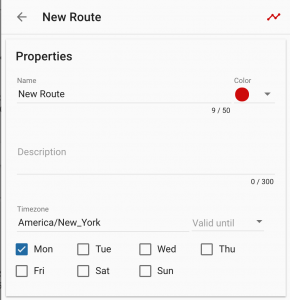
Routes have the following properties:
- Name – route name
- Color – path color
- Description – text description of the route
- Timezone – the time zone for the checkpoints time
- Valid until – the route will repeat weekly on the days of the week you specify until this date
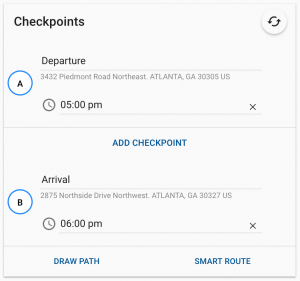
After clicking on CREATE ROUTE, the first thing you’ll do is click anywhere on the map to set the Departure, and click again to set the Arrival point.
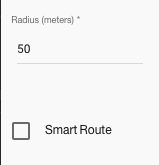
After this you can scroll down and draw a path, or create a SMART ROUTE, which will create a path to join the two points by the most optimum distance.
The Departure and Arrival are default checkpoints, you can change the name and the scheduled time that the entity is supposed to be there. There is a 5 minute grace period on the application from the time scheduled where it will be considered “on-time”.
You can also add checkpoints, see the following video on how to do it.
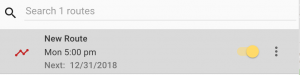
Once you have a route created you can see when it’s scheduled next from the routes list
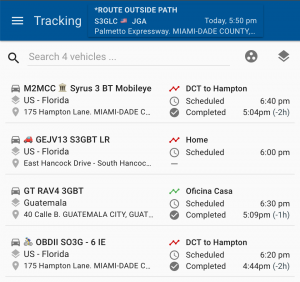
From the tracking entity list you can ![]() switch view to see when a route is scheduled for multiple entities.
switch view to see when a route is scheduled for multiple entities.
Importing Routes
You can import routes from another entity or a file.
To import from another entity that already has a route assigned click on the + button on the bottom right of the routes list and click on the ![]() button, select the entity and the route to import.
button, select the entity and the route to import.
To import a route from a file you can do so from the and click on ![]() Import from File, filetypes supported are KML & GPX – Example KML, Example GPX
Import from File, filetypes supported are KML & GPX – Example KML, Example GPX
Monitoring Routes
Single entities:
Routes can be monitored in real time in the tracking dashboard, the trips card will convert to a Routes card when the entity is currently on a route.
Routes will show up in tracking 2 hours before the scheduled start time, and up to 4 hours after they’re done, unless there’s another pending route that comes before.
![]()
Multiple entities:
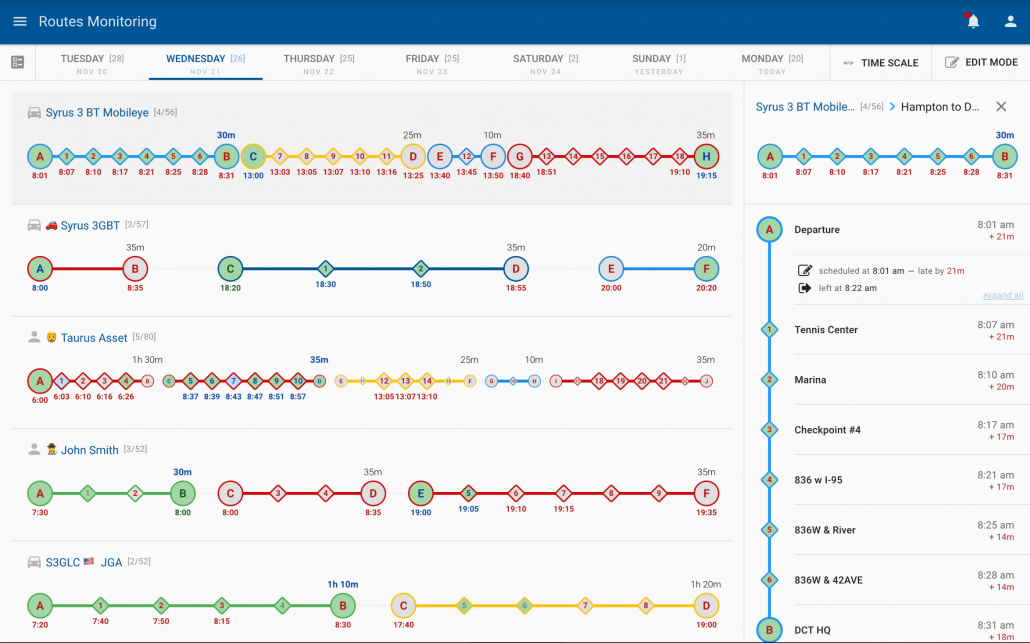
You can monitor and view the history from multiple entities from the ![]() Routes Monitoring app in the main menu. Start by selecting the entity which has the route assigned, and click the blue GET button along the bottom.
Routes Monitoring app in the main menu. Start by selecting the entity which has the route assigned, and click the blue GET button along the bottom.
The days of the week are in tabs along the top and you can click on to see the history of completion of the route.
The departure and arrival are circles with letters, while the diamonds with numbers are the checkpoints.
Color Scheme:
Background shaded color:
- White – Checkpoint has not been visited
- Gray – Violation of the visit (the entity did not stop there)
- Blue – Violation of the duration (either the entity left too early, or it stayed in the checkpoint too long)
- Red – Violation of duration & arrived late (when the entity got there late, and also either stayed too long or too little.
- Green – Entity reached the checkpoint at the correct time
Font color:
- None – no time underneath the checkpoint means there was no scheduled time of arrival
- Black – scheduled arrival time
- Red – Checkpoint not visited at the scheduled time
- Green – Checkpoint visited at the correct time (+/- 5 min of the scheduled time)
- Blue – Checkpoint was visited ahead of time
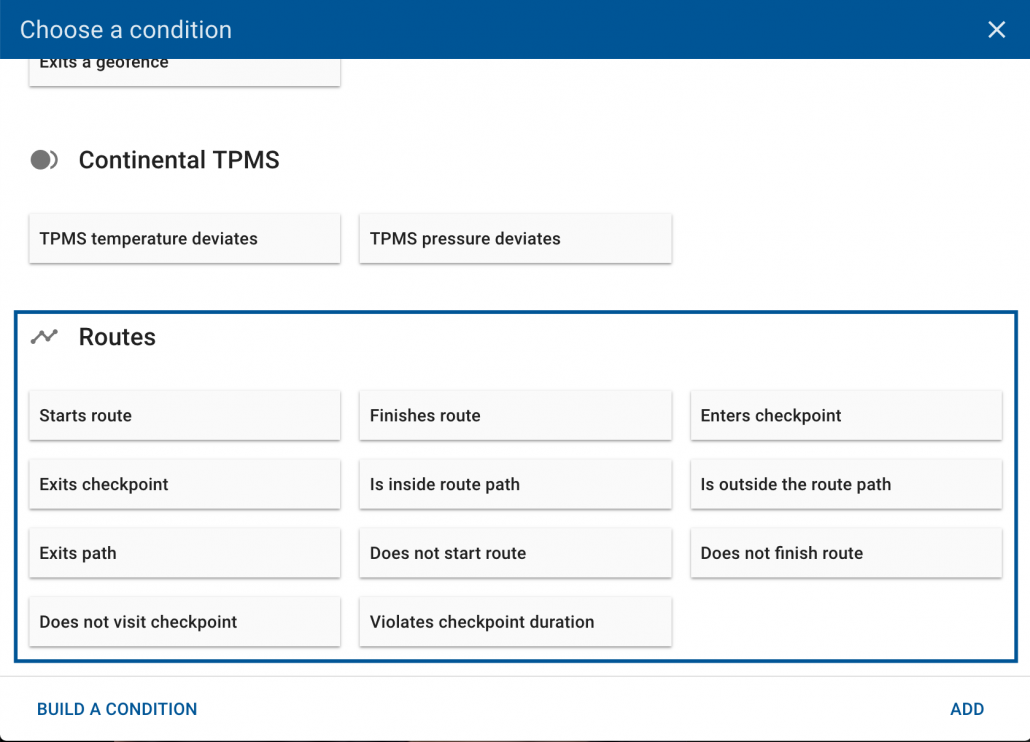
Route Alerts
From the automation module you can create an alert using various conditions from Routes.
- Starts/finishes route – when the entity starts or finishes a route – fires one time
- Exits checkpoint/path – when the entity leaves a checkpoint or exits the path – fires one time
- Is inside/outside route path – when the entity is inside/outside the path – permanent while the condition exists
- Does not start/finish route – this is the same as the entity starting the route late or not finishing on time – one time
- Does not visit a checkpoint – missed a checkpoint (any checkpoint that’s not marked optional)
- Violates checkpoint duration – overstays or leaves early based on the duration
Route Alert Sample Messages
Use the following as sample messages for alerts related to routes.
Condition : “Finishes route”
Vehicle {{object.name}} has finished the {{body.route.name}} route.
Condition: “Exits path”
Vehicle {{object.name}} has deviated from the path of {{body.route.name}} route.
You can check if the vehicle is currently inside or outside the path of the route and incorporate this into your messages with:
{% if body.route.is_outside_path %} Outside route path {% else %} Inside route path {% endif %}
With this you can list the route’s checkpoints:
{% if body.route %}
The vehicle is currently on {{body.route.name}} route, it has to visit the following checkpoints:
{% endif %}
{% for checkpoint in body.route.checkpoints %}
    {{checkpoint.name}}
{% endfor %}
Sample output:
The vehicle is currently on Thursday Evening YMCB20 route, it has to visit the following checkpoints:
    Departure
    Checkpoint 1
    Checkpoint 2
    Checkpoint 3
    Arrival
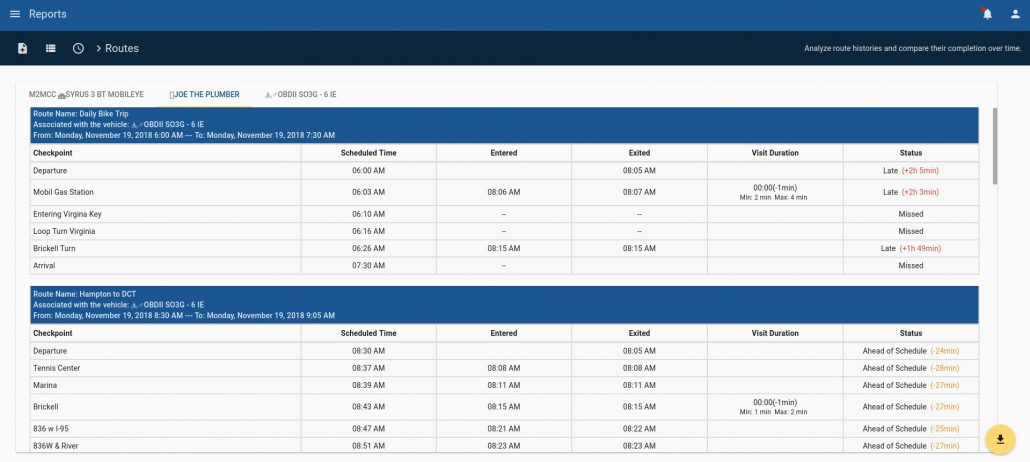
Routes report
The routes report gives you an overview of the route and it’s completion, whether or not the entity visited the checkpoints, the status of its time, and if it was late by how long.
Geofences
Use Cases
- Control and manage one vehicle or an entire fleet and know when they enter or exit a specific area setup by in a geofence
- Setup custom notifications/triggers based on a particular status and whether the vehicle or fleet is inside or outside the geofences, for example idling in specific location, or ignition turned OFF inside another location
- Know when your employees enter or leave a place such as a warehouse, visit customers, etc
- Know the times that delivery drivers leave or enter places, you can achieve this with geofences.
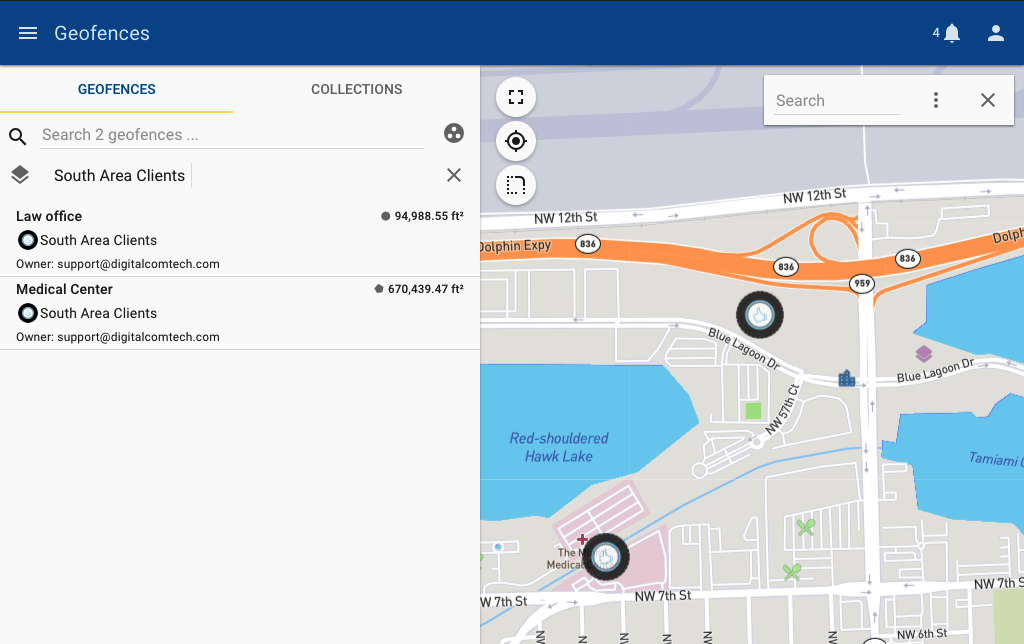
Geofences (geometric fences) are virtual areas on the map that you can create ![]() . They can be used as a way to enhance and add more meaning to the location of an entity. For example you may want to put the name of a particular place on the map, geofences let you do this. Geofences can also be used along with notifications for alerting when an entity enters or exits a particular area of the map.
. They can be used as a way to enhance and add more meaning to the location of an entity. For example you may want to put the name of a particular place on the map, geofences let you do this. Geofences can also be used along with notifications for alerting when an entity enters or exits a particular area of the map.
In tracking it can give you a better idea of where your entities are since you can define the name of the geofences.
![]()
If the entity is inside multiple fences, the smallest fence is shown first and then you can expand the list clicking the dropdown arrow and the rest of the geofences (smallest to largest) will show.
![]()
Creating a Geofence
To create a geofence you can do it from anywhere the map is visible,
If you are viewing the map on a small screen, such as a phone or tablet, you’ll find a search icon on the map, ![]() after clicking it you can click on the
after clicking it you can click on the ![]() icon that displays a menu, from there you can either select
icon that displays a menu, from there you can either select ![]() to draw a circular region, or
to draw a circular region, or![]() to draw a polygonal region.
to draw a polygonal region.
Line
Click on the ![]() icon to create. Next, click anywhere on the map to start the linear geofence, you can click multiple places and it will create a straight line between the points you clicked on. While creating the geofence an option will appear on the bottom left which includes the radius of the line and whether or not to join points via a route on the map.
icon to create. Next, click anywhere on the map to start the linear geofence, you can click multiple places and it will create a straight line between the points you clicked on. While creating the geofence an option will appear on the bottom left which includes the radius of the line and whether or not to join points via a route on the map.
To finish simply double click on the last point, then a dialog will appear where you can save the route and assign it to a collection if you want.
Circle
Click on the ![]() icon to create. Next, click anywhere on the map, press and drag outwards from the center without lifting the mouse, after dragging release the mouse press and a dialog will appear to name the geofence you created.
icon to create. Next, click anywhere on the map, press and drag outwards from the center without lifting the mouse, after dragging release the mouse press and a dialog will appear to name the geofence you created.
Polygon
Click on the![]() icon to create. Next, click anywhere on the map and start drawing the borders of the geofence you want to create. To finish drawing just click on the first point.
icon to create. Next, click anywhere on the map and start drawing the borders of the geofence you want to create. To finish drawing just click on the first point.
Note that the max amount of points a polygon can have is 200.
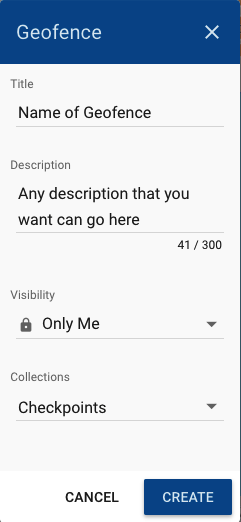
Once you’re done creating any geofence you’ll have a dialog that shows up where you’ll enter the name of the geofence, a description, choose who can see the geofence (public, people in your group, or private), and whether or not it belongs to one or more collections (groups of geofences).
Geofence Menu Options
Edit
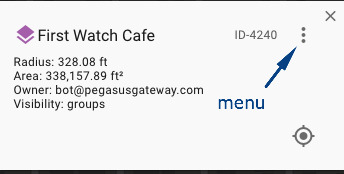
To edit geofences first you can search it’s name in the Geofence Search box to find it or click the geofence itself in the map to bring the Geofence Property Details popup box.
Once you have the Geofence Property Details popup box click on the 3 dots menu button and click on the Edit option at the top of the menu.
Once in the Editing section you can add or change the following information:
- Name
- Description
- Owner
- Visibility
- Select a collection, multiple collections or remove any or all the collections.
- Properties (Like speed limit) and/or custom properties, For example: additional details about it.
Hide
Hide the actual geofence in the map (make it not visible)
Nearby
Bring a list of the vehicles close to the geofence showing the last time they reported and how far are they from the geofence.
QR Code
QR Code used for “check-ins” with Taurus Application.
Redraw
To modify the actual geofence itself’s size and/or shape
Export
Download the Geofence in a GeoJSON format file
Share Location
Share geofence’s location via Waze &/or Google Maps
Delete
Permanently eliminates the geofence
Geofence Collections
Geofence collections are groups of 1 or more geofences, they can be assigned a particular color and icon.
Collections are very useful when you want to work with notifications, by using a notification that works over a collection you’ll save yourself the trouble of having to update a notification whenever you create a new geofence.
Create
In order to create a collection you’ll need access to the Geofences module, you can get there from the main menu.

Once in the geofences module you’ll go to the tab that says Collection, and click on the ![]() bottom right of the list.
bottom right of the list.
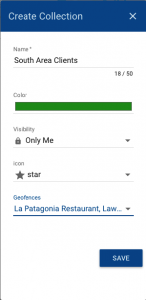
From here you can give the collection a name, color, visibility (All, Group or Only me “Private”), icon, and select the geofences that belong to that collection.
Customizing the Icon
To add your own icon you can go to the bottom of the Icon list, and select Custom Icon.
This will open an input for you to place a URL to the location of that icon.
We recommend that the custom icon be square in dimensions, and either a png, jpg, or ico.
Let’s say that we have this link where the icon is located:
https://cdn2.pegasusgateway.com/images/geofences/sites/1/sample.png

Next, you’ll want to shorten this link so that it’s accepted, to shorten a link you can use a service such as: https://bit.ly/ Simply paste the link of the image there, and it shortens it so that you can paste it on the dialog: https://bit.ly/2nmDSSv
![]()
Edit
To edit a collection you go to the Geofence module, then click on Collections tab, search for the collection you want to edit then click on the pencil icon to edit the collection.
This will open the collection properties and you would be able to edit: the name, color groups, icon and add/remove geofences to the collection.
Hours of Service
Automatically keep track of driving hours and generate Logbooks with the Hours of Service module.
Requirements:
- Setup up the device’s segments in the Segments Management Section
- To record a driver’s service hours, she/he must be a traceable asset. Consult Assets Section
Filter by the entity or entities to see its hours of service. By default, it shows the cycle from the latest seven days, but you can filter any date. The graph shows the cycles in the selected date range.
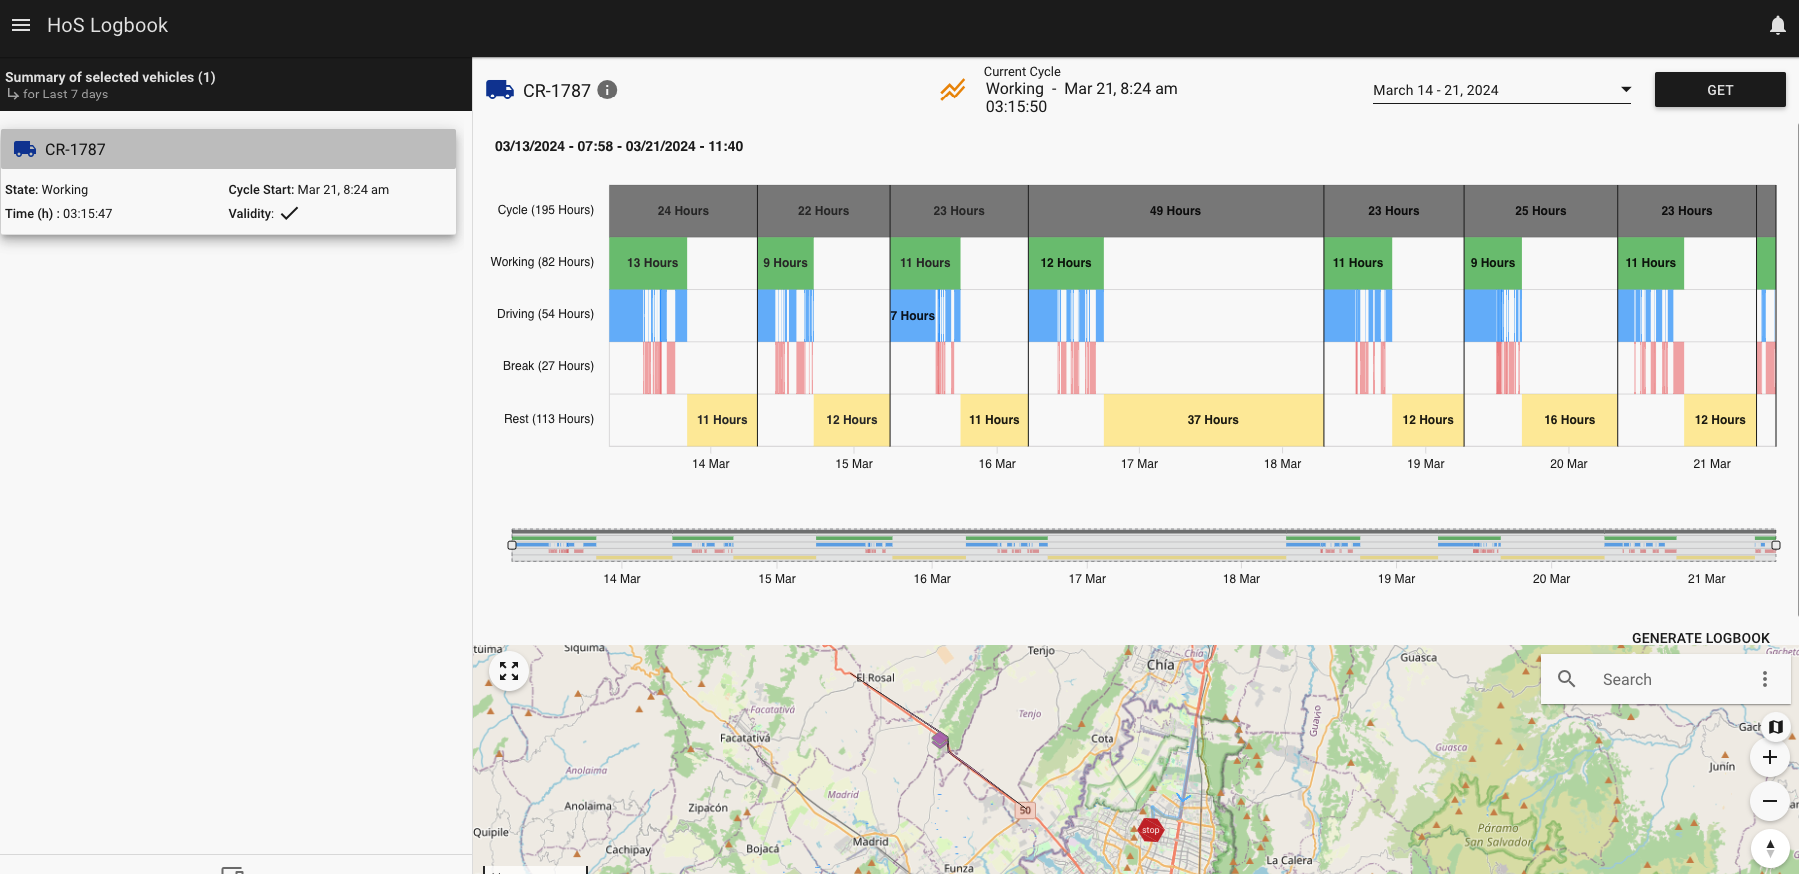
Cycle: total hours of cycles during the selected range. The vertical black line divides one cycle by another.
Working: total hours worked during the selected range.
Driving: total hours driving during the selected range. The driving time is included in the worked time.
Break: total hours of break during the selected range. The break time is included in the work time. The break time includes time not driving.
Rest: total hours in which the entity was not in service, means the total hours the unit was not working.
Current Cycle: show the status of the current Cycle, in this example, the status is Working, which means that the vehicle is currently working, more information in Tracking Hours of Service.
Example:
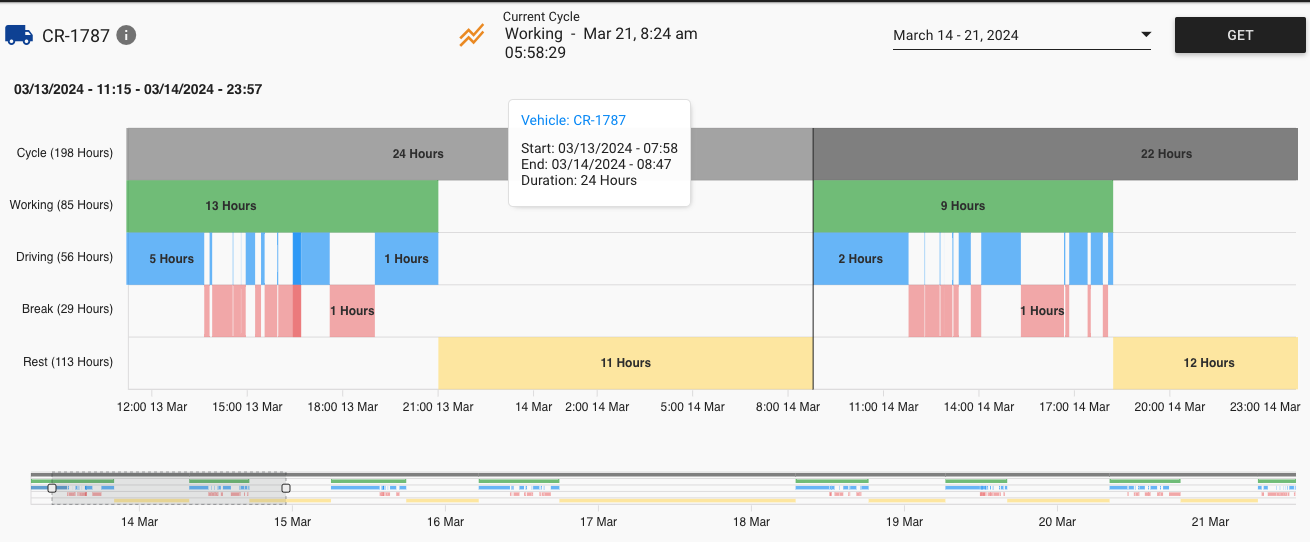
This vehicle started its cycle at 07:58 AM on March 13th, 2024, and ended at 8:47 PM on March 14, 2024, so the cycle lasted 24 hours. One cycle will include one working segment and one resting segment. The entity started its working segment on March 13th, 2024, and kept working for 13 hours, during its working time the driver kept driving continuously for 5 hours (reflected in the blue bars) and taking break times (reflected with the red bars) after he/she finished his working segment, he/she rest for 11 hours, and after that, he/she continued with another cycle that started when the driver began to work. The black vertical line divides one cycle from another
The ![]() button shows the logbook per day.
button shows the logbook per day.
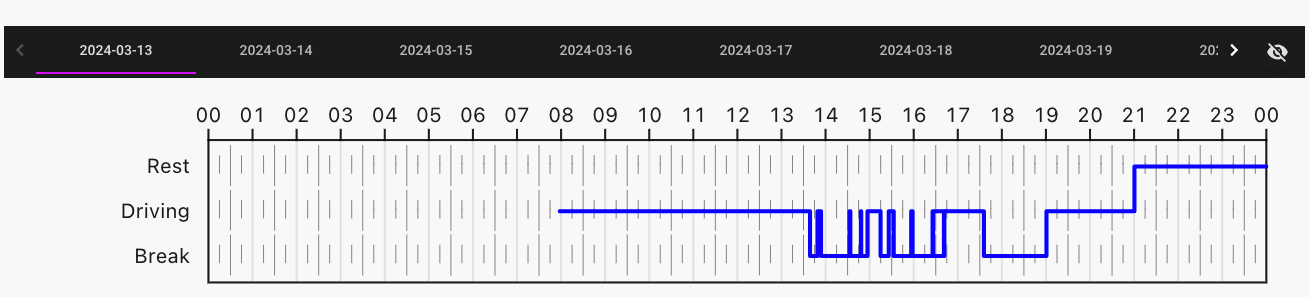
In this case, the blue line starts at 7:58 am, which is the same hour when the entity starts work, after 5 hours of driving the entity takes a break, and after, it continuos driving and taking breaks until it begins resting.
Automation
Automation is a module that is used to create alerts & notifications for your vehicles. It can be used to send an email as simple as when your car reaches your home, to as complex as generating a phone call with a custom message or turning your car off remotely (provided the necessary installation is done).
Automation combines the possibility of selecting multiple conditions to fire different actions, we call these advanced notifications – triggers.
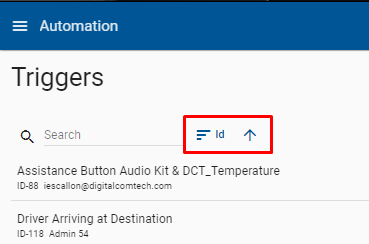
In the main view of the Automation module you can see all the triggers, this list can be ordered by id or by creation date with the button on one side of the search bar.
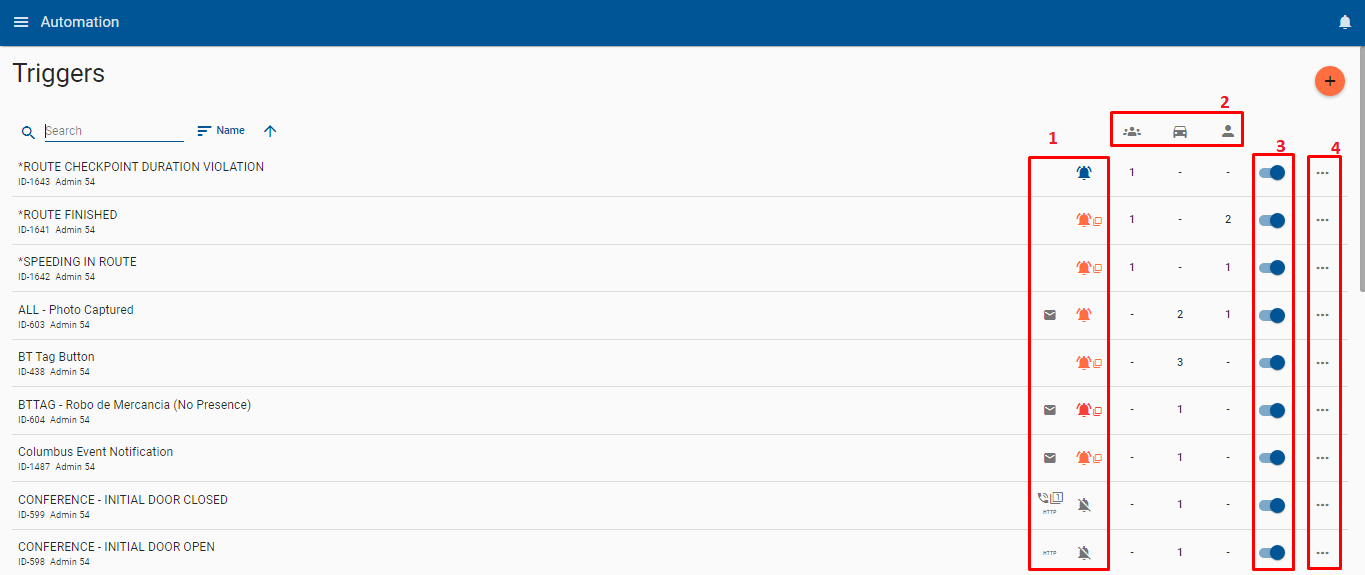
To the right of the triggers there is a panel that indicates what actions has the trigger (1), if it is assigned to a group, vehicle or asset(2), if the trigger is on or off(3) and finally the option to copy or delete a trigger (4).
There’s 3 main steps to creating any trigger:
- Select the conditions that must be met to fire the trigger
- Select the entities or vehicles & assets that the trigger will apply to
- Select the actions the trigger will perform once the conditions are met
Lets start by making a simple trigger for notifying when the ignition of our vehicle is turned ON and send an email notification.
Name your Trigger
From the automation module click on the top right icon to create a new trigger, and give it a name.
Add your Conditions
To add conditions start by clicking on the ![]() button, this brings up a dialog where you can choose from several predefined conditions. We’ll start simple and select the first one Ignition turns ON.
button, this brings up a dialog where you can choose from several predefined conditions. We’ll start simple and select the first one Ignition turns ON.

Select your Entities
Click on the entities tab, and select the entities that you want to apply the trigger to, in this case we’ll select Vehicles and click on the vehicles that we want to monitor this notification with. Note that you can select multiple groups / vehicles / or assets.
Select the Actions to Perform
Now we can select what happens when the ignition is turned ON for any of the vehicles we selected. We have several actions available:
- Alerts – these are alerts that appear as popup on the gateway, and we’ll see later that they can be browsed on the Alerts app
- Email – this will send an email notification to any of the emails written here
- Safe Immobilization – this will activate the safe immobilization feature of your vehicle if it’s installed
- Output Management – this will activate or de-activate the device’s outputs
- SMS & Voice Calls – this will send an SMS Text Message or place a Phone call to any number destination*
- External Integrations – send an HTTP request to an external API
* – note that the SMS & Voice calls requires a subscription service, please talk to your gateway administrator for more information.
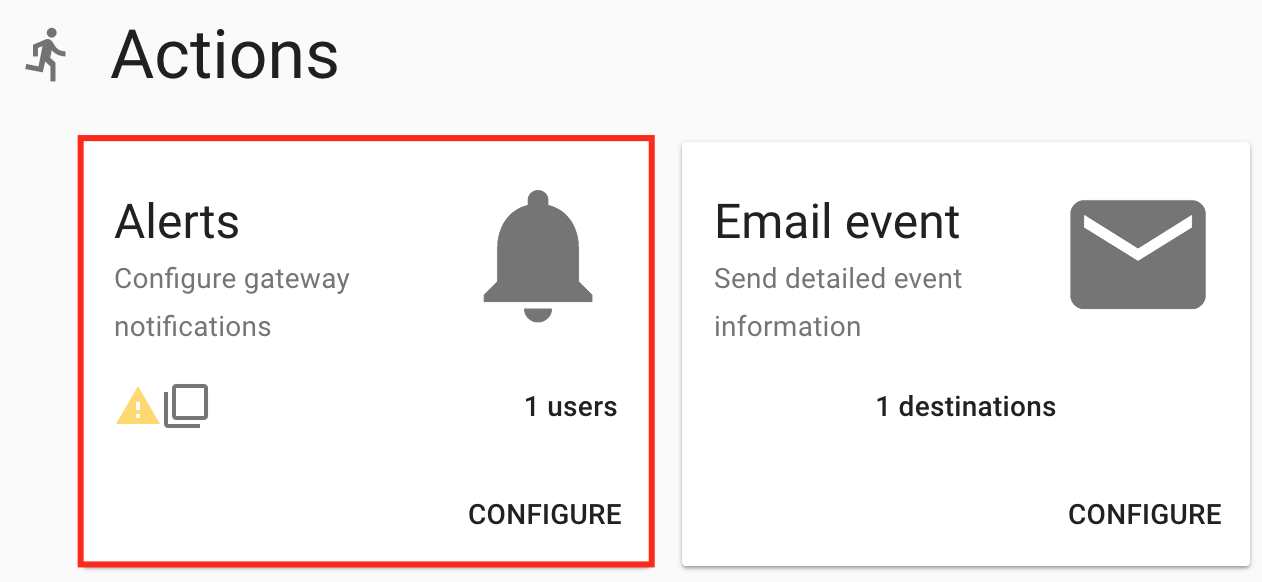
Alerts
Click on CONFIGURE next to Alerts & Create a Gateway Alert, this will bring up a list of users on the right hand side, by default the creator of the alert is selected. You can choose to make it Informative, Warning or Critical, these levels are optional and can be used to distinguish the importance of the alert. For example in the Alert card inside of tracking dashboard, you will see Critical alerts first, then any warning and information type next.
The function of the “entity icon” is change the icon and/or the icon color of a Vehicle in the tracking module when the trigger is fired
![]()
The icon returns to normal when the alert is resolved in the Alerts app.
Email Event
Press the back button to go back to the list of actions and click on CONFIGURE next to the email action. Click on the input and you will see a dropdown of users in your group, or else write any email you want to notify.
Save the Trigger
The options tab is optional but it’s where you can customize the time zone of the trigger or how many times it will fire. Click on the SAVE button on the top right of the page to finish creating your trigger.
You’re all set to receive an email notification and generate an alert inside the system when any of the vehicles we selected turn ON.
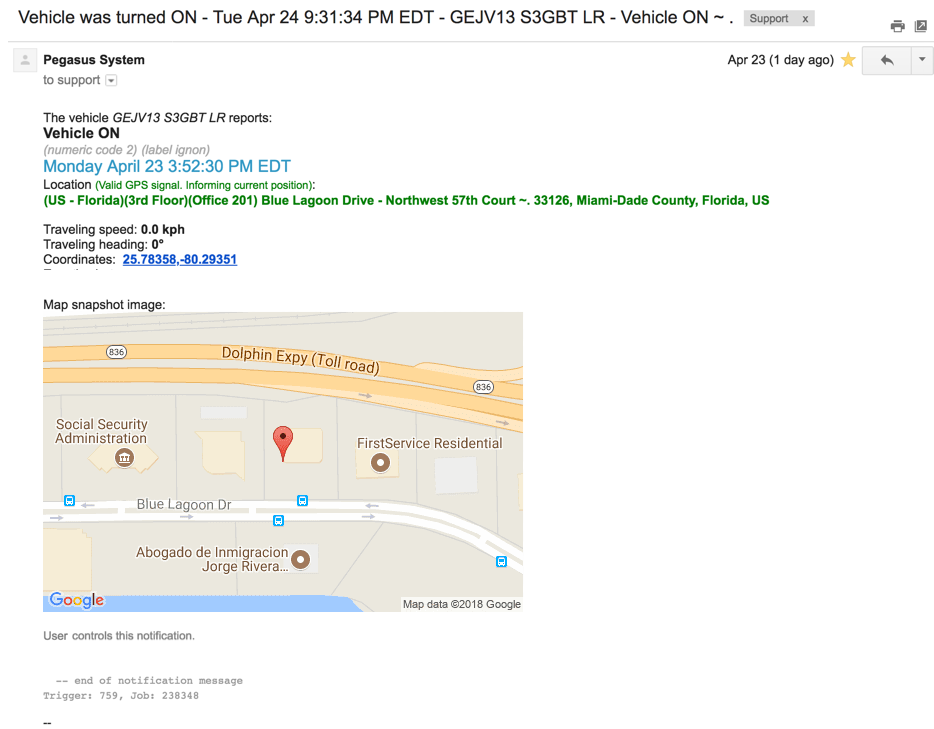
Sample Email
The email that the system generates will automatically contain the following information:
Subject: Name of the trigger – time it was generated – entity name – event that triggered the alert.
Body: Name of the vehicle, the event, the time and date, the address of the place the alert was generated, the speed, heading and coordinates, and a map snapshot of that location.
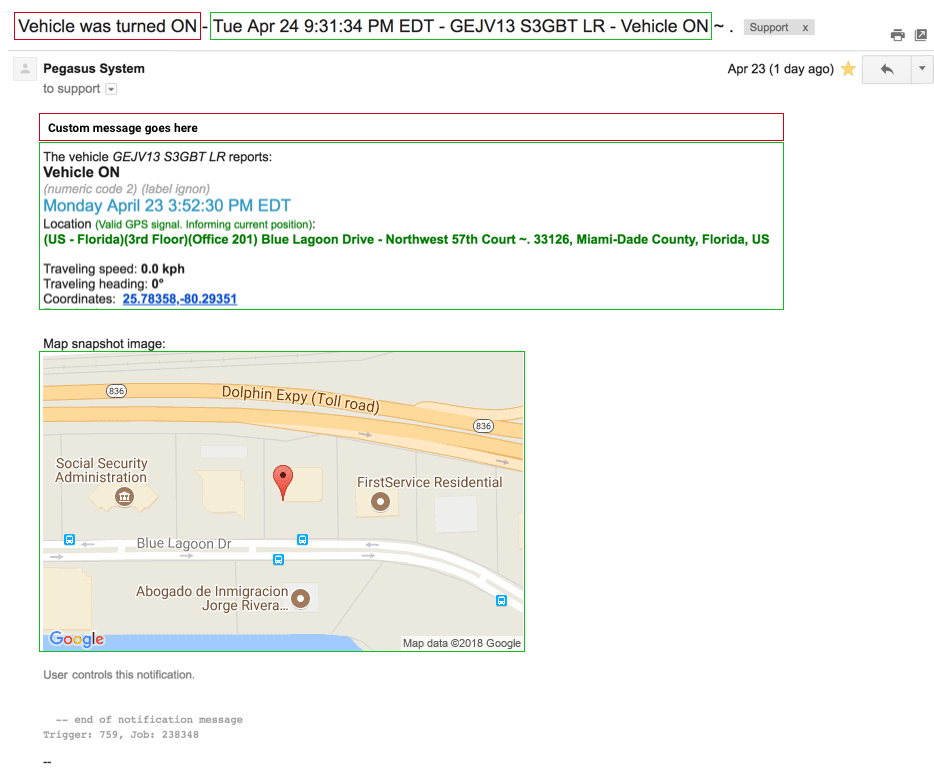
Optional: Adding a Custom Message
You can add a custom message to the alert by going back to the Conditions tab, and going down to the “Default Message” section. Then write your custom message.
It will appear inside the email you send, and on the alert that’s generated inside the gateway. Note the red area, which are the customizable sections of the alert.
If you also require it, you can make use of the other actions of the platform, below are some examples of them.
Optional: Safe Immobilization
In the actions you can configure the safe immobilization by pressing the configuration button and then selecting whether to activate or deactivate it. Note that the safe immobilization requires a professional installation of the device’s output cable to a relay inside the vehicle.

Optional: Output Management
In the same way as safe immobilization, in this section you can manage any of the Syrus outputs
This example activates output 2 and deactivates extended output 1

Optional: SMS
You can configure Pegasus to send personalized SMS messages to assigned numbers.
The option send from device allows you to send an SMS from the sim card that the Syrus has entered. (the sim card must have the possibility of sending sms).
Optional: Voice Call
You can configure Pegasus to call the numbers you assign with a personalized message. Calls are configured with:
- To: Call recipient
- Language: language that will be spoken by the caller
- Gender: gender of the person who will make the call
- Loop: number of times the message will be repeated
- Dialog: personalized message
Optional: External Integrations
You can send an HTTP request to an external API or even consume the same Pegasus APIs.
The following example uses the Pegasus API – it uses $pegasus_api which is a shortcode used to replace the base_url of the API – thus we can use: $pegasus_api/vehicles/{{object.id}}/plugins/photocam/ to tell Syrus to take a photo. (camera accessory required). Note that object.id refers to the ID of the entity that generated the trigger.
Tip: you can use the /event-photos api to add a photo to an external resource request, note that you’ll want to add a countdown of at least 1 minute to allow time for the photo to upload.

Trigger Options
The trigger options are used to have more control over the trigger, it allows you to set a limit for how many times it should fire, or create a timed countdown till the actions are fired.
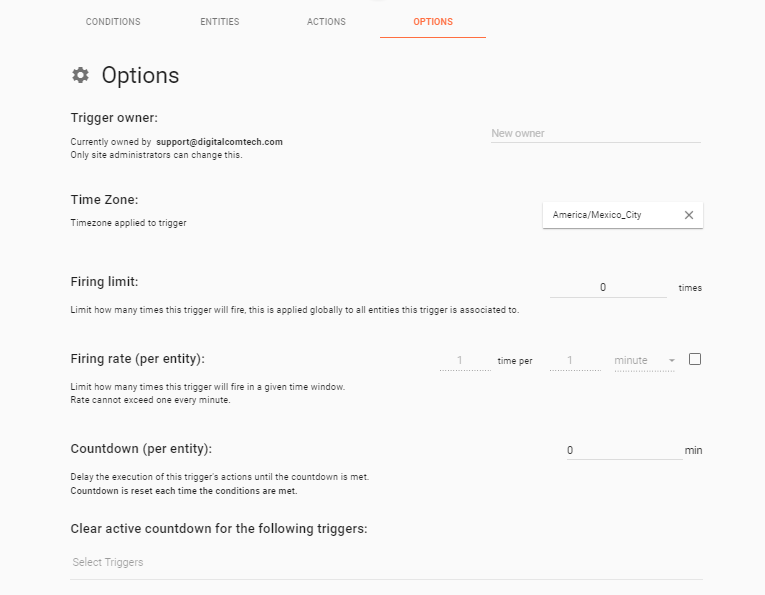
Owner: Owner option is used to change the owner of the triggers. When modifying this trigger owner, all associations (vehicles, assets, groups, etc.) will be updated to reflect the access of the new owner.
Time zone: The time zone option is used when sending a date/timestamp in a trigger message, for example the time that appears in the email is controlled by this Time Zone option. By deafult it is set to the timezone of your computer browser.
Firing limit: The firing limit is used to fire the trigger a limited number of times, in other words as soon as the trigger fires by the number that’s put here, it will stop sending messages. Please note that a change in the trigger’s condition’s resets this firing limit. Also, note that when the limit is reached the trigger WILL STAY ACTIVE.
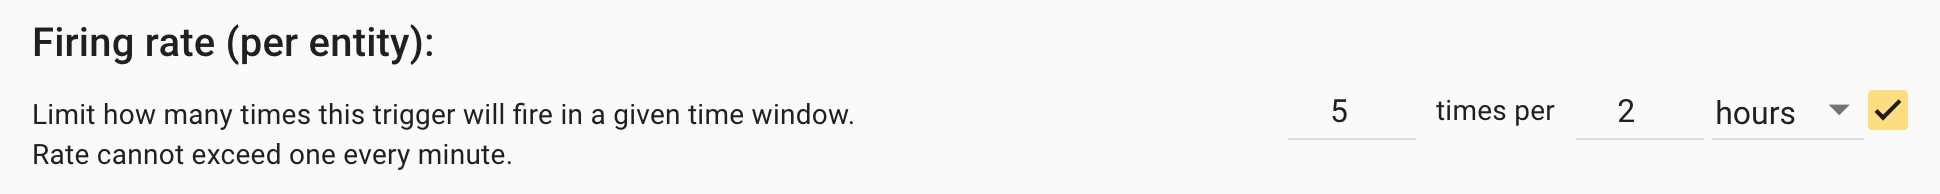
Firing rate: The firing rate is a limit of how many times the trigger will generate in a given time window. This is useful to avoid receiving repeated triggers within a certain time frame, for example the vehicle is speeding and you only want to be notified when it happens 5 times within 2 hours. If the trigger generates 6 times in less than 2 hours then it will ignore the last time that it met the condition and not fire the actions. This applies per entity, so if you select multiple vehicle’s each one will have it’s own ‘up to 5 times in 2 hours’ rate
Countdown: The countdown is a delay in the firing of the trigger’s actions. It is recommended that this is used with a “Clear active countdown for the following triggers” option. Let’s take a real world example.
Let’s say that we want to be notified when the vehicle spends more than 20 minutes inside a particular geofence with the Ignition ON.
To do this we first create a trigger that has the condition: Ignition is ON AND Is inside a geofence and we give it a countdown of 20 minutes.
This means that when the condition is met, the countdown starts counting down.
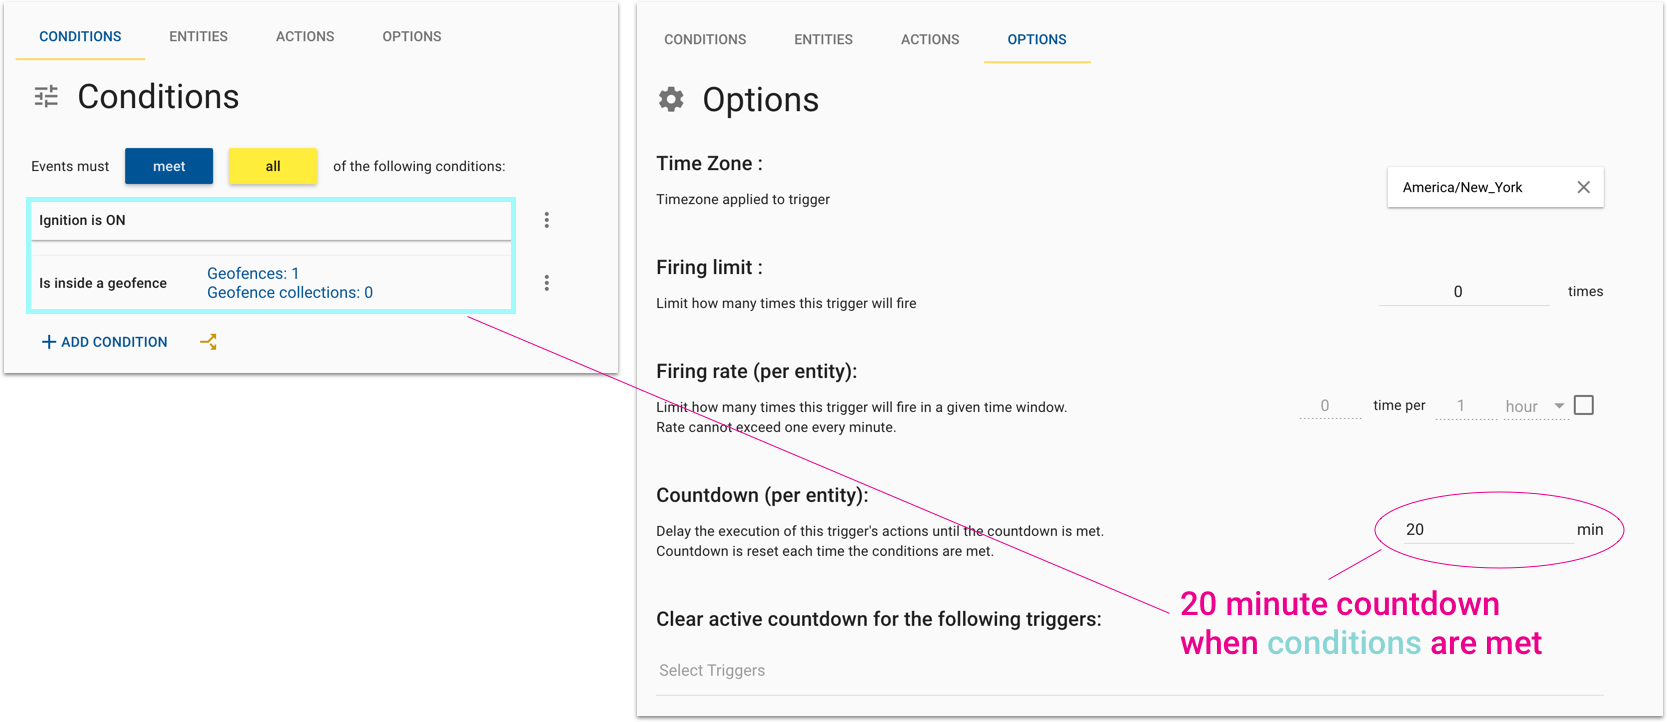
TRIGGER: Vehicle stopped in unauthorized zone for too long
Then we create a new trigger to get rid of, or clear this 20 minute countdown,
the conditions for this new trigger can be whenever the Ignition is turned OFF OR Is outside a geofence
TRIGGER: Clear countdown of vehicle stopped for too long in unauthorized zone
Thus we would have a trigger that fires a notification after 20 minutes of detecting that the vehicle is inside of a zone with the ignition ON.
Alerts & Notifications
The alerts & notifications module is where we can browse & attend the generated gateway alerts or manage system alerts.
Alerts
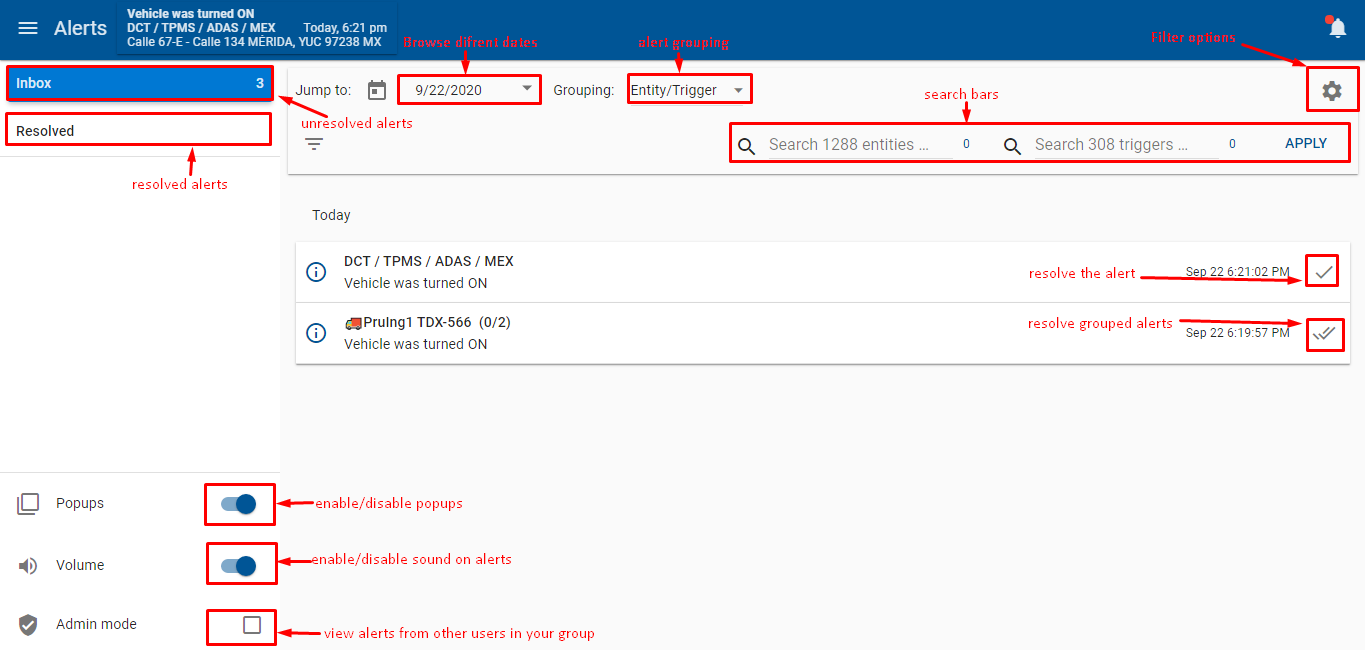
Clicking on Inbox, will show you any unattended alerts, note that this module updates in real time, so there’s no need to refresh, the alerts will come in and update automatically.
Attending Alerts
To mark an alert attended you can either click on the ![]() next to the name of the alert, or open it by clicking on it’s name, and clicking on the RESOLVE button on the bottom. Note that Critical alerts require a comment before marking them as resolved.
next to the name of the alert, or open it by clicking on it’s name, and clicking on the RESOLVE button on the bottom. Note that Critical alerts require a comment before marking them as resolved.

Once you’ve attended several alerts you can click on the ![]() button to clear them.
button to clear them.
Notifications
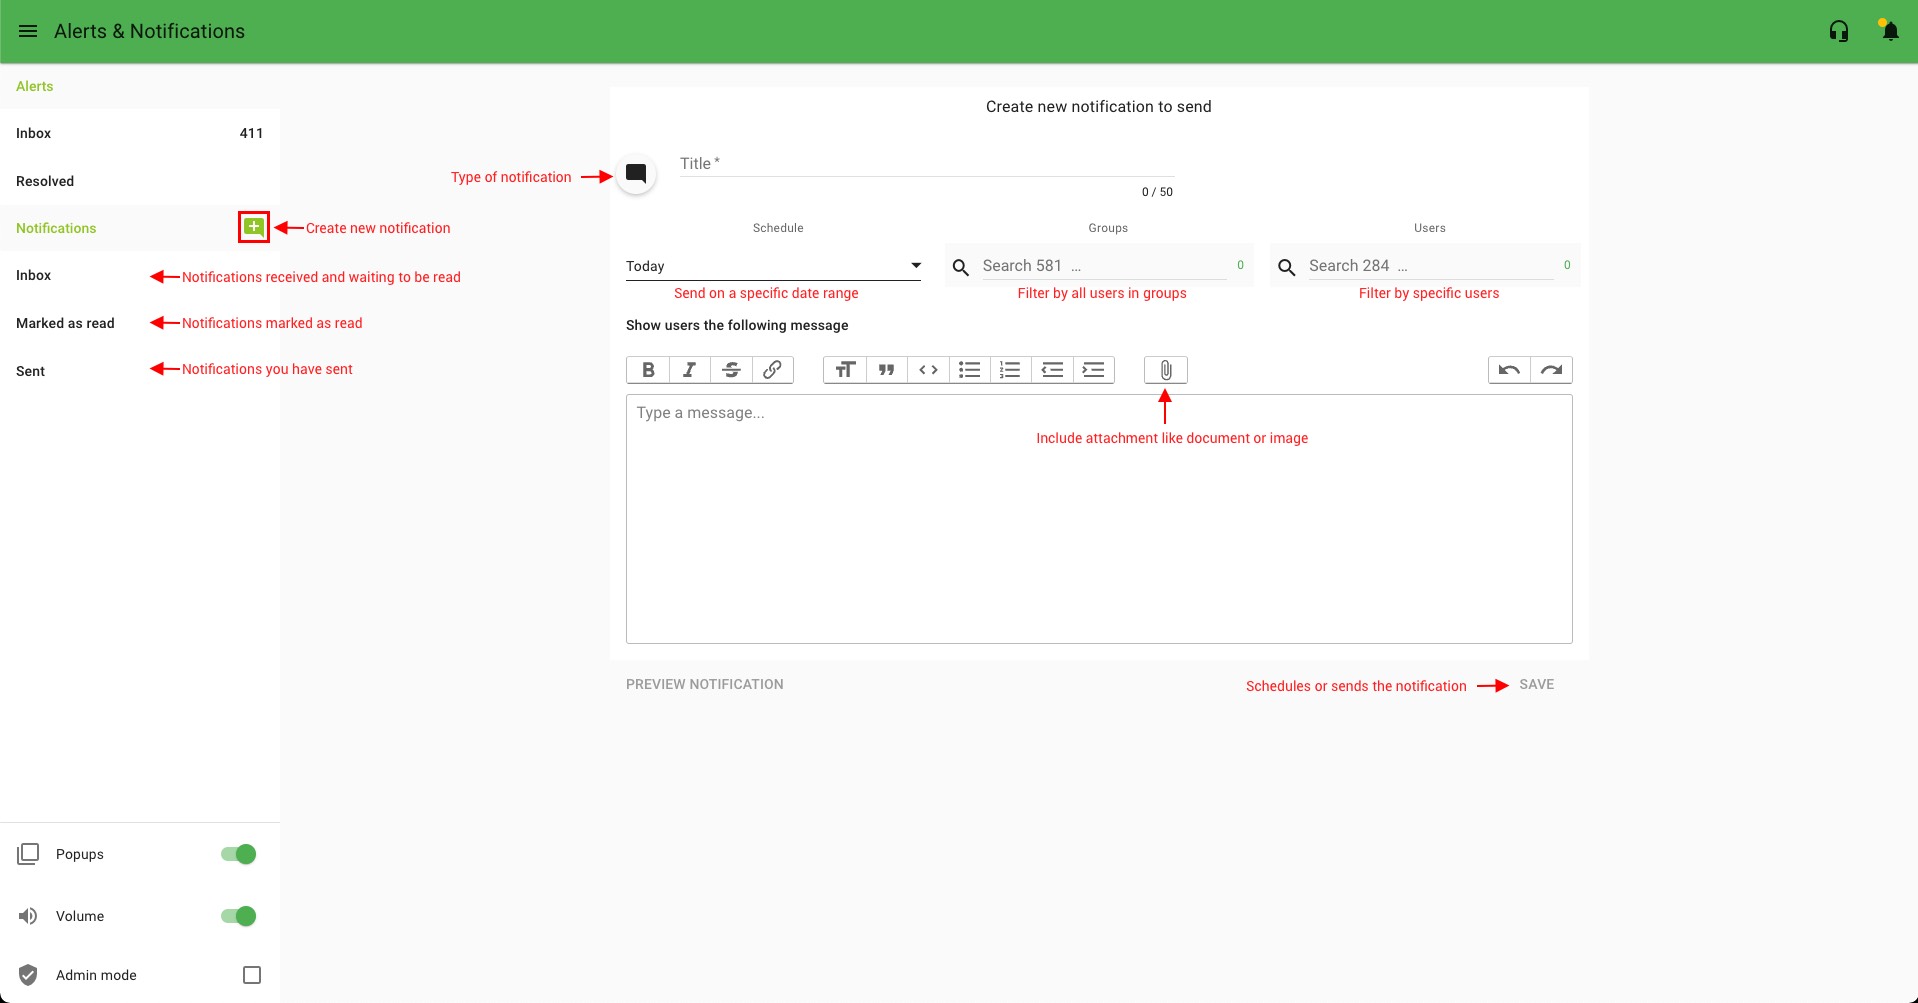
Notifications are custom messages that can be generated for other users on a specific schedule. The notifications can have rich text including attachments like images or documents.
To get started click on the create new notification ![]() button next to the Notifications section, type in the message and hit SAVE.
button next to the Notifications section, type in the message and hit SAVE.
Overview of Notifications
Once a notification is SAVED the user will receive it and get a popup message on the top right corner.
Message Templates
Message templates:
Depending on the conditions that were selected, one of the following
Using the + symbol on the bottom right, you can choose from predefined message templates:
Or customize your own with advanced conditional statements:
Tip: you can see the full content of the possible fields to build templates, with:
{{body}}
If
The vehicle reported: {% if body.label == "panic" %} panic button pressed {% endif %} {% if body.label == "spd" %} speeding event {% endif %}.
If/Else
{% if body.valid_position %} position is valid {% else %} position is not valid {% endif %}
Operators
On this example the trigger identifies the temperature in each of the three temperature sensors (a, b and c) and send a message when the threshold has been reached for each sensor, either for high or low temperature.
{% if body.temp_a__c >= 35 %}
    Temperature above 35°C detected in Sensor A, current value: {{body.temp_a__c}}°C
{% endif %}
{% if body.temp_b__c < 17 %}
    Temperature below 17°C detected in Sensor B, current value: {{body.temp_b__c}}°C
{% endif %}
{% if body.temp_avg__c >= 35 %}
    Average temperature from all sensors, above 35°C, current value: {{body.temp_avg__c}}°C
{% endif %}
Full Example:
{{object.name}} REPORTS {% if body.label == "ignon" %} ENGINE ON {% endif %}{% if body.label == "ignoff" %} ENGINE OFF {% endif %}{% if body.label == "pwrloss" %} TRACKING DEVICE POWER DISCONNECTED {% endif %}{% if body.label == "pwrrstd" %} TRACKING DEVICE POWER RESTORED {% endif %}{% if body.io_ign and body.mph > 65 %} OVER SPEED ALERT, TRAVELING AT {{body.mph}} {% endif %}{% if not body.io_ign and body.mph > 20 %} TOWING ALERT {% endif %}
Also can modify the value of the parameters body.params with any of this operations, only need to follow the next format
Subtract
{{body.sv | subtract:10}}
Multiply
{{body.sv | multiply:10}}
Divide
{{body.sv | divide:10}}
Integer
{{body.sv | integer}}
Also allows you to chaining functions like the example
{{body.sv | divide:10 | integer}}
Geofences
Shows the name of the geofence the vehicle entered:
{{body.entered.0.properties.name}}
Shows the name of the geofence the vehicle exited:
{{body.exited.0.properties.name}}
Condition to identify Turn ON/OFF<
Ignition is {% if body.io_ign %} ON {% else %} OFF {% endif %}
Dates
Dates can be modified to show in a custom format using
Current date
Shows the current date and time:
{% now "H:i:s A" %}
{% now "h:i A" %}
{% now "l, M j Y H:i:s" %}
{% now "l, M j Y H:i A" %}
Example output:
10:04:36 AM
10:04 AM
Friday, Dec 14 2018 10:04:36
Friday, Dec 14 2018 10:04 AM
You can also use the locale timestamp which adds translation:
{{body.locale_datetime}}
{{body.locale_datetime_short}}
which results in:
Lunes Octubre 4 1:59:14 PM CST
Lun Oct 4 1:59:14 PM CST
Example with localtime and tz library:
{% load tz %}{% localtime off %}{{body.event_time|date:"l, Y j M H:i A T"}}{% endlocaltime %}
Lunes, 2022 21 Mar 14:17 PM EDT
Other functions
timesince
Formats a date as the time since that date, for example, if you want to know the time since the event was generated from the device to the time it was received on the server, you can use:
There was a {{body.event_time|timesince:body.system_time}} delay from the time the event was generated by the time it was received on the server.
Example output:
There was a 2 minutes delay from the time the event was generated by the time it was received on the server.
widthratio
Allows you to divide values, for example if you’re getting the bluetooth tag temperature it’s reported as: btt_temp: 235, to convert this to 23.5 use widthratio of 10, the format is
The temperature of the cargo: {% widthratio body.btt_temp 10 1 %}°C.
Example output:
The temperature of the cargo: 23.5°C.
The hourmeter of the vehicle is: {% widthratio body.vehicle_dev_ign 3600 1 %}H
Example output:
The hourmeter of the vehicle is: 2318H
Frequently Asked Questions
- I just received an email, why am I not seeing an Alert inside the system?
- An email is not necessarily a Gateway alert, the Alerts module only shows alerts that are gateway generated, they are associated to a level: informative, warning, or critical. Check the trigger for the alerts option to be enabled.
- I am an admin, why can’t I see all the alerts?
- By default the system only shows you alerts which you are assigned to, even if you are an administrator you only have access to the alerts that are directed towards you. You can view other users’ alerts by clicking on the Enable Admin mode button on the bottom left corner of the Alerts app,
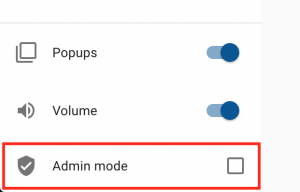
- or by clicking on the alerts icon on the top right, opening the settings and clicking on the Enable Admin Mode button.

- My trigger is firing a lot, what did I do wrong?
- One of the most common mistakes when working with triggers is that the conditions used are matching multiple scenarios. For example, if you want to be notified when the ignition is turned ON inside a geofence, don’t select the “Ignition is ON” and combine this with the geofence, instead select the “Ignition is turned ON”, that way it only occurs once.
- Know the difference between when to use a label and when to use the trigger parameter keys, for example, if you want to know when the Input 3 is ON, don’t build the condition “Input 3 is ON”, because Input 3 may stay ON depending on the sensor / button / switch that’s connected to this input, instead select a Label: in3on that fires once when the condition is met on the device.
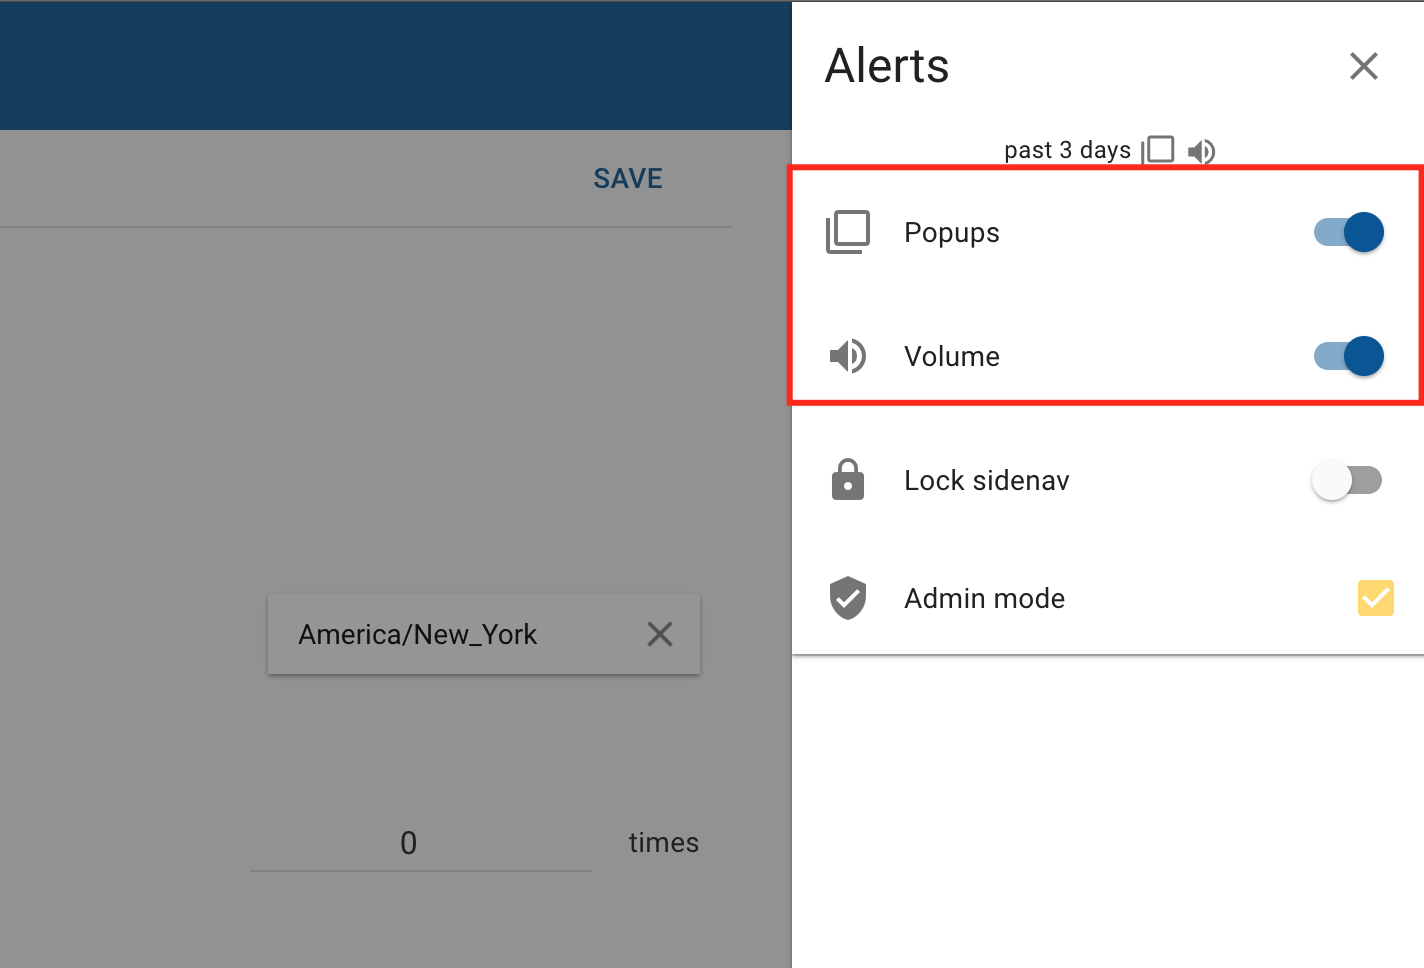
- Why am I not getting a popup alert or sound?
- First make sure that your options are enabled for your user.
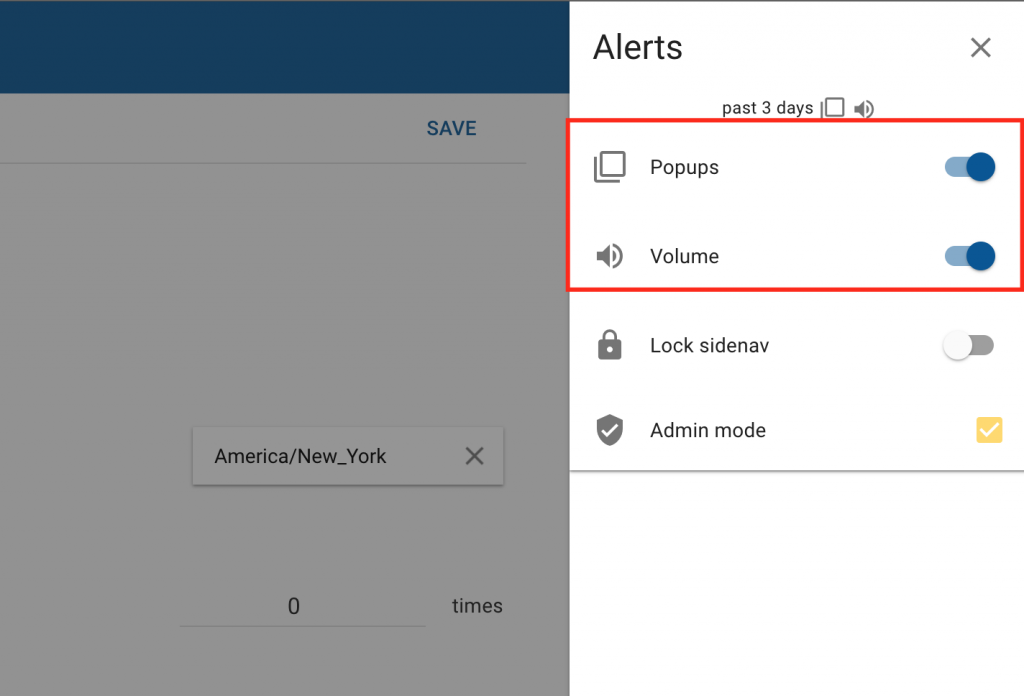
- Next, make sure you allow popups for the browser:
- Double check that the tab you have open is not muted, you can right click on the tab and check if there’s an unmute option, if that option is not there then proceed.
- When I receive the coordinates there’s a comma in the latitude & longitude?
- To fix this you can use stringformat:”f” filter, example:
https://maps.google.com/maps?q={{body.lat|stringformat:"f"}},{{body.lon|stringformat:"f"}}prints: https://maps.google.com/maps?q=7.916460,-72.472190
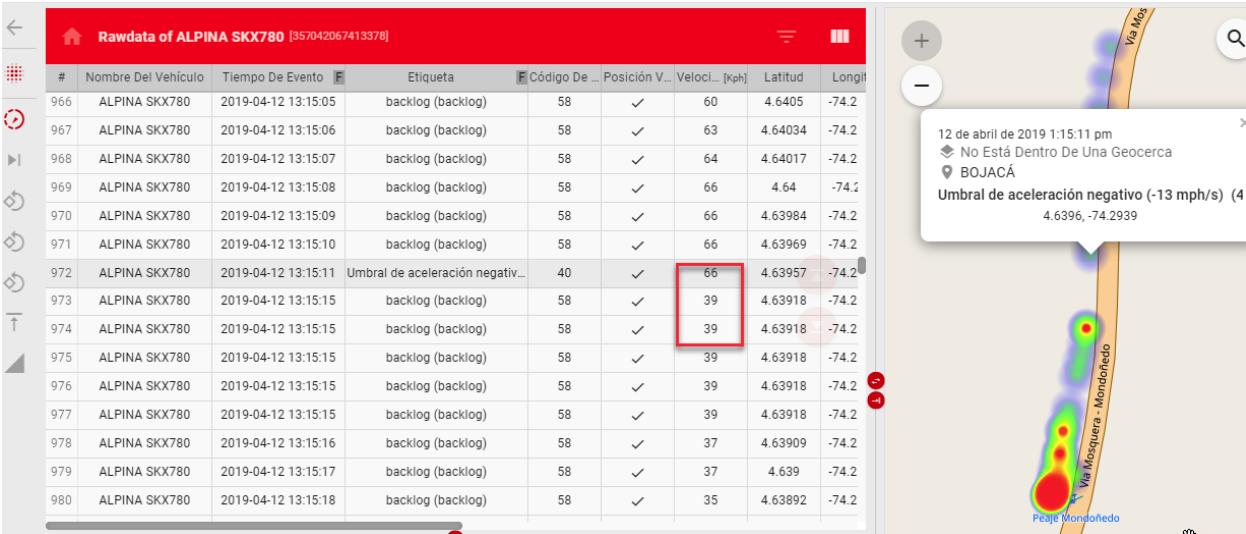
Rawdata Data Analysis
The rawdata application allows you to see a report of all the events and data transmitted by your devices directly to the Pegasus servers as is. With the app you can also visualize the data on a map and apply filters.
Generating Rawdata Reports
To obtain a raw data report, go to Rawdata module, then search for the vehicle or vehicles you want to get the report from, select the date or date range you want and click OK to generate the on screen report.
Parameters
There are more than 500 parameters you can filter for a report and out of those, there are 10 predetermined by default which are: Altitud, Event Code, Event Time, Label, Latitude, Longitude, Map URL, Speed, Valid Position and Vehicle Name and You have the option to select and/or deselect any of them*
*Parameters will show data as long as the data is reported by the devices

Heatmaps & Event Count
Once you run a rawdata report, you will have plenty of information including heatmps and event counts which will help with an easy and simple to use yet powerful tool to diagnose any device reporting to Pegasus Gateway.
In the above example we used Speed, Altitud, HDOP & RSSI parameters to visualize in the heatmaps along with the event counts at the bottom of the page, which you can choose from Event Label, Event Code, Event Count by Day, by Weekday and/or by Hour
Another example with heatmaps can be with the generation of driver behavior alerts, such as aggressive acceleration, hard braking, sharp curves, etc. With these events filtered you can view them on a heatmap and really get an idea of where they occur.

And possibly identify any causes or improvements based on the road conditions.
Columns Visualization
Once you run a report you have the option to hide columns to better analyze the data, to do this just click on the 3 vertical bars menu icon a the top right corner of the report, it will open a sub-menu listing the parameters in the current report, to hide a column, just click the eye icon to its right, then click the APPLY bottom (to visualize those parameters/columns again, just uncheck them.
Event Filters
If you need to focus on specific events you can filter them to show only data for those events/parameters filtered. To do this you just need to click on the upside down triangle filter icon at the top right corner of the report, this will take you to another screen where you can select what events and/or parameters to filter. In the below example we are going to filter the ignition state parameter (Ignition ON/OFF)

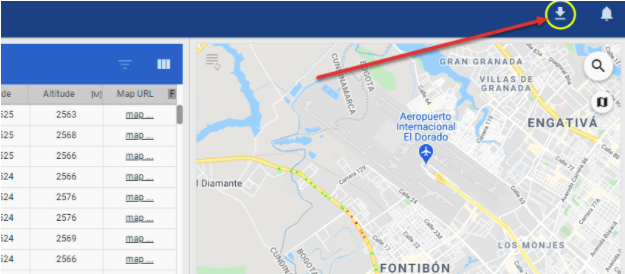
Data Download
You can download the rawdata reports in a .csv format. To download the data, click the Download Data icon (Arrow pointing down) at the top right corner of the page.
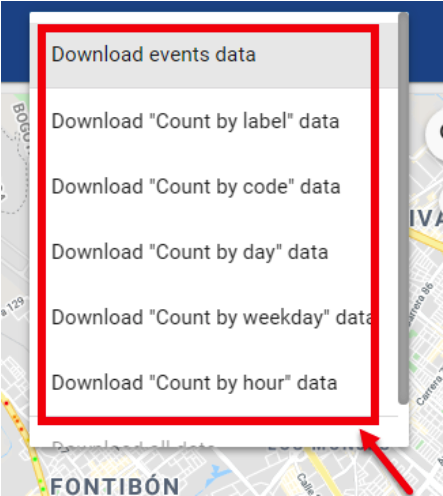
You will have the option to select what do you need/want to download, for example: events data, Count by label, Count by code, Count by day, Count by weekday and Count by hour data
Report Templates
To facilitate the usage or the rawdata reports, we have templates available so you don’t have to select the parameters you normally use to run your reports.
Please note that these templates are saved locally on your computer’s browser, and if you switch computers or a new browser then the templates are not going to appear.
You can activate/deactivate the Template search box by clicking on the Pentagon icon at the top right corner of the report area.

With the rawdata you have 2 Templates already included: Default Fields & Basic Fields templates. You can add different customized templates with the parameters of your choice, for example we are going to use the Default Fields template as based and add 3 more parameters (Temperature/Analog Sensor A, Temperature/Analog Sensor B and Temperature/Analog Sensor C)
Once you select the parameters you want to add or delete, just click on the save icon (disk shaped icon) at the right side of the template search box. To delete just click on the delete (trash can) icon to the right side of the save button.
Taurus Rawdata
You can obtain a report for Taurus application rawdata, for this just click on type of tracker device filter button, then search for a single Taurus device and/or multiple Taurus at the same time, select the date and/or date range you want to to get the report on.
Reports
The reports module gives you the ability to create and schedule reports for any of your vehicles. Most reports that are generated include 3 main files, a summary, a detail, and an analysis.
- The summary provides a quick overview of the information contained in the details.
- The details go more in-depth about the contents of the report and list the specific incidents or occurrences of each metric.
- The graph shows in a visual manner the information that’s found in the summary.
Generated reports can be downloaded in 3 formats: CSV, XLSX, or PDF.
The navigation of this section has 3 main icons in the top left corner:
 Create New Reports
 View Generated Reports
 Schedule Recurring Reports
![]() Note that reports that have more than 10,000 details are not georesolved (converted into an address), so only the GPS coordinates of the event are shown in the report.
Note that reports that have more than 10,000 details are not georesolved (converted into an address), so only the GPS coordinates of the event are shown in the report.
Live Reports
The live reports generate data in real-time, they wait for the vehicles to report data in order to show it.
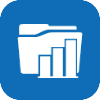 Engine Dashboard
The Engine Dashboard report gives you a quick overview of any engine parameter that is supported by the truck/vehicle. It supports multiple vehicles simultaneously sending data.
Note that the table is populated when the vehicle is ONLINE and sends a report.
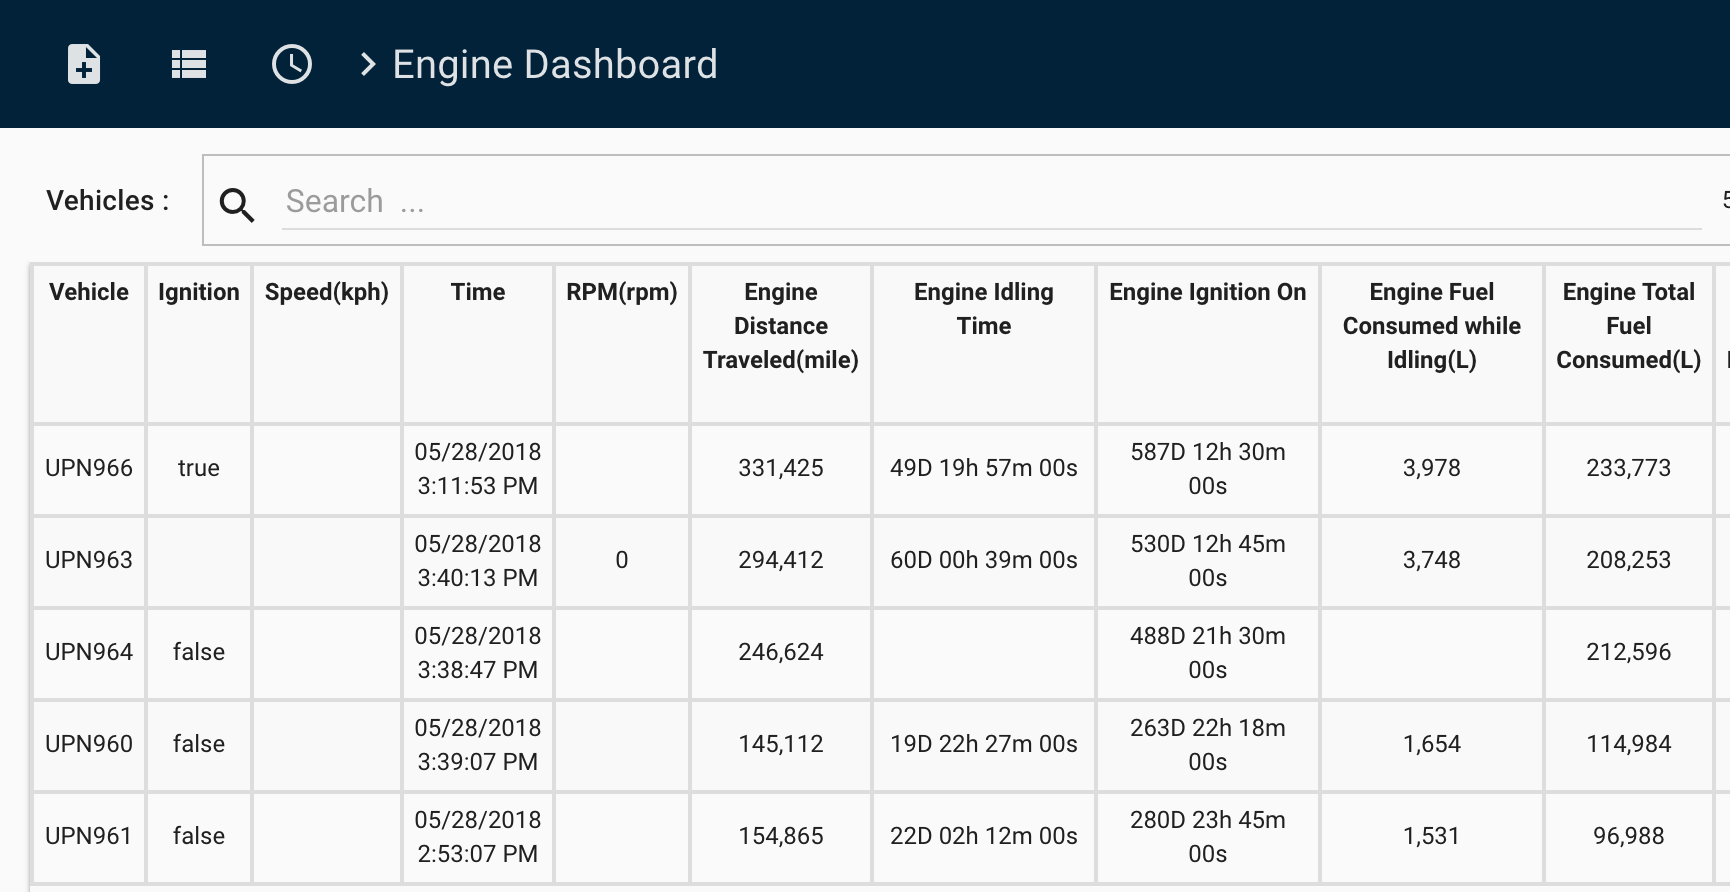
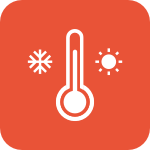 Temperature
The temperature report shows you the live temperature of one or many entities. This report is compatible with the following entities that report temperature:
- Titan
- Bluetooth Tag – can also report the relative humidity as a %
- Temperature Sensor Accessory – can report the state of inputs
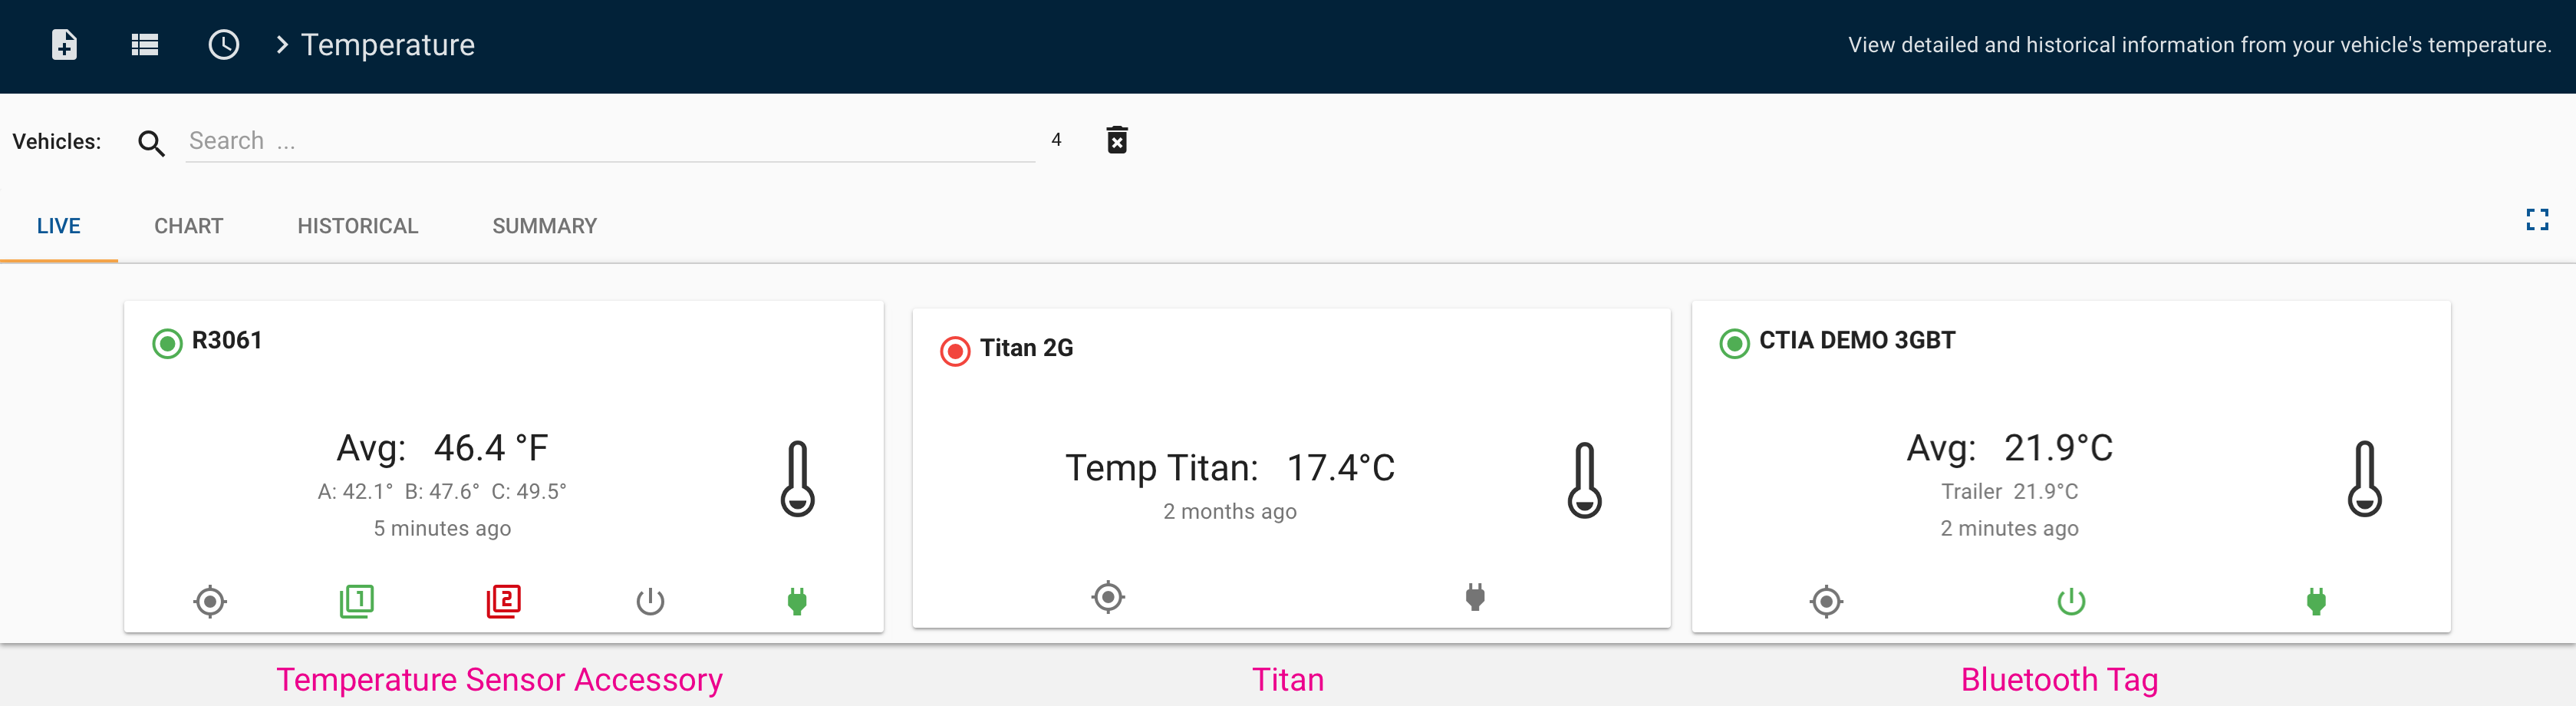
Sections in this report include:
- LIVE – a live dashboard like view, that compares different entities capable of reporting temperature.
- CHART – a look at the temperature variations over time.
- HISTORICAL – temperature values over time in a table format, can be downloaded.
- SUMMARY – summary of the average temperatures on a daily basis per entity.
 Fuel Level ECU
Get a historic look at how the ECU Monitor reported the fuel level from either the analog level (from the gray and blue cables) or the percentage value read from the onboard computer.
If the fuel is measured using the percentage there’s an extra column in the Details that shows an approximate fuel consumed per trip.
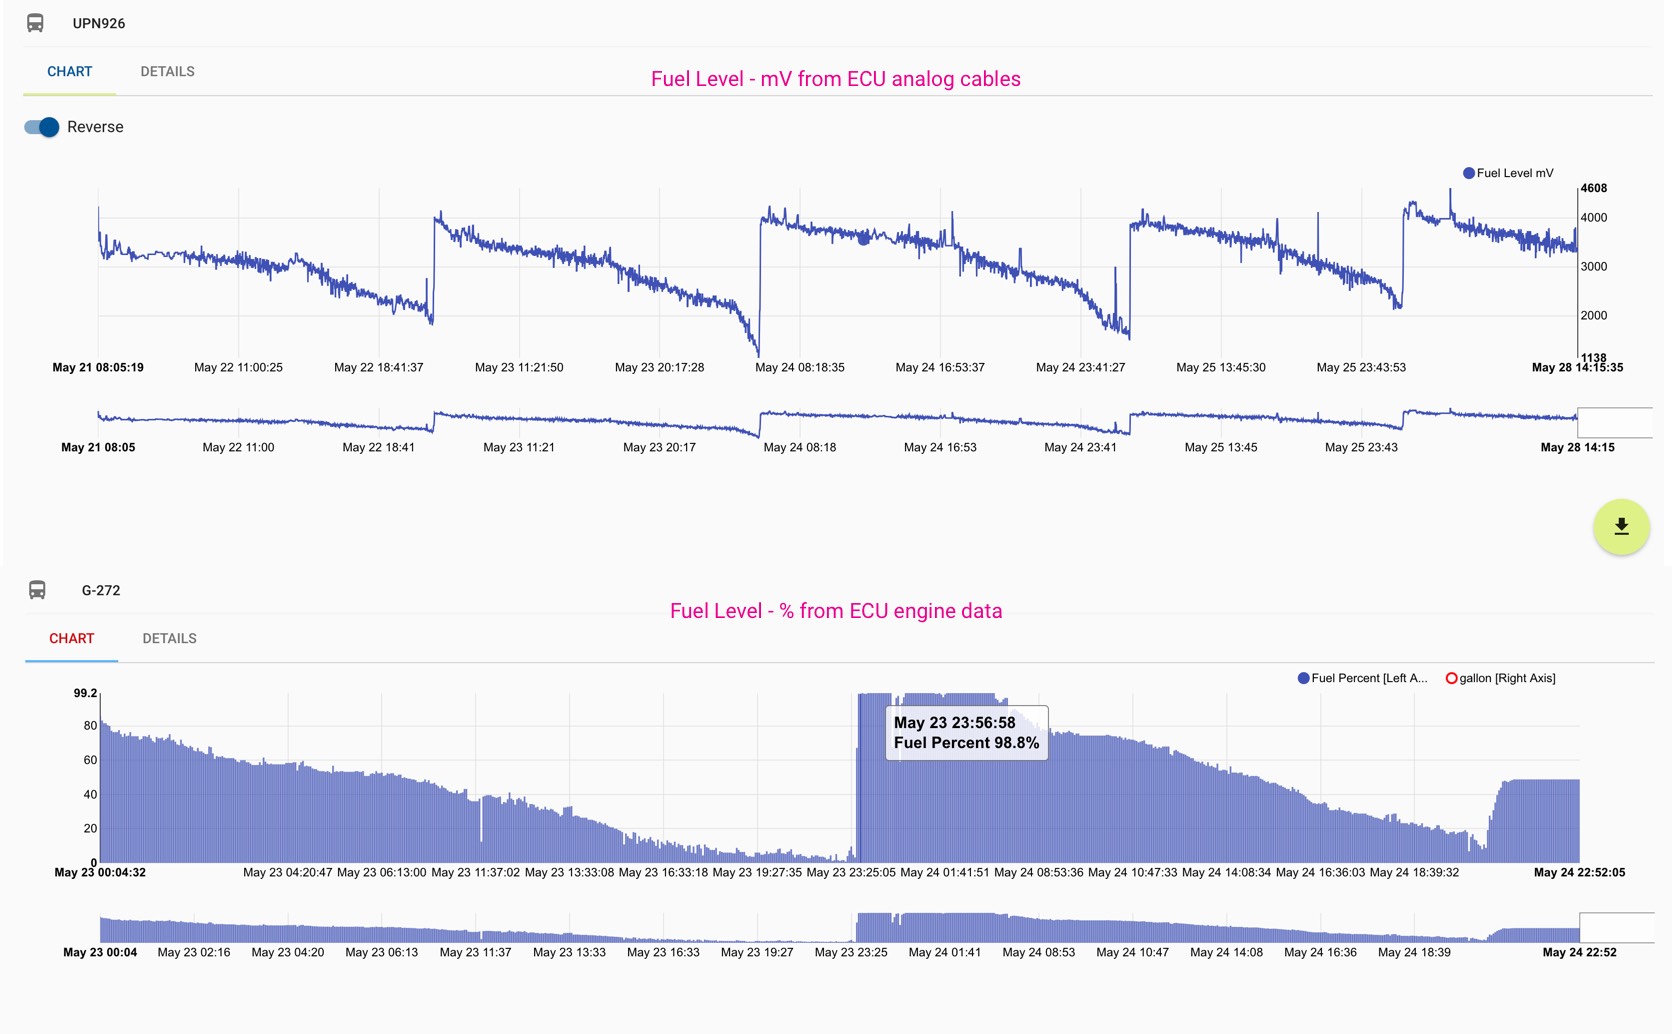
Note that the Fuel Tank size is a parameter that can be saved on the vehicle’s information in the Organization module.
 Fuel Level Technoton
Get a historic look at how the Technoton Fuel Level Rod sensor reported the fuel level.
In the details of this report you’ll also get an estimated fuel consumed and efficiency per trip.
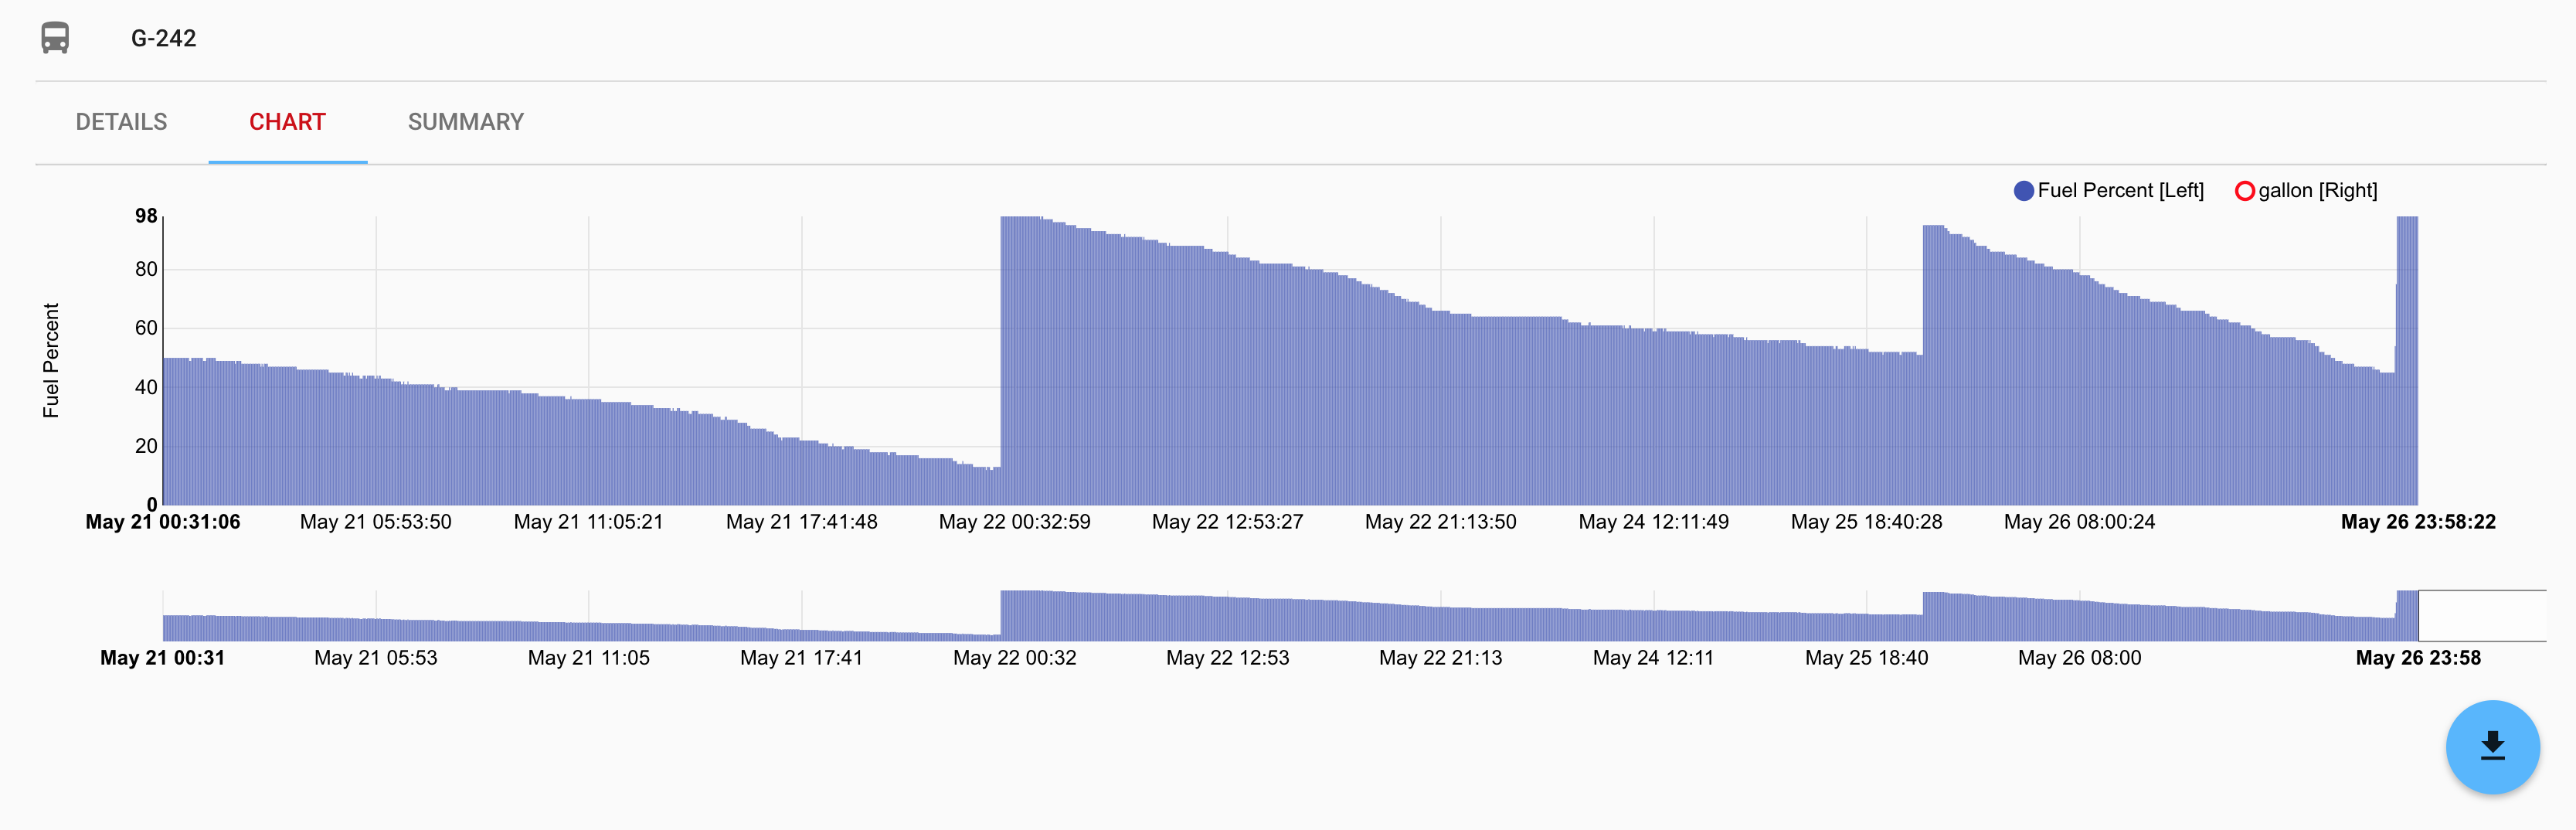
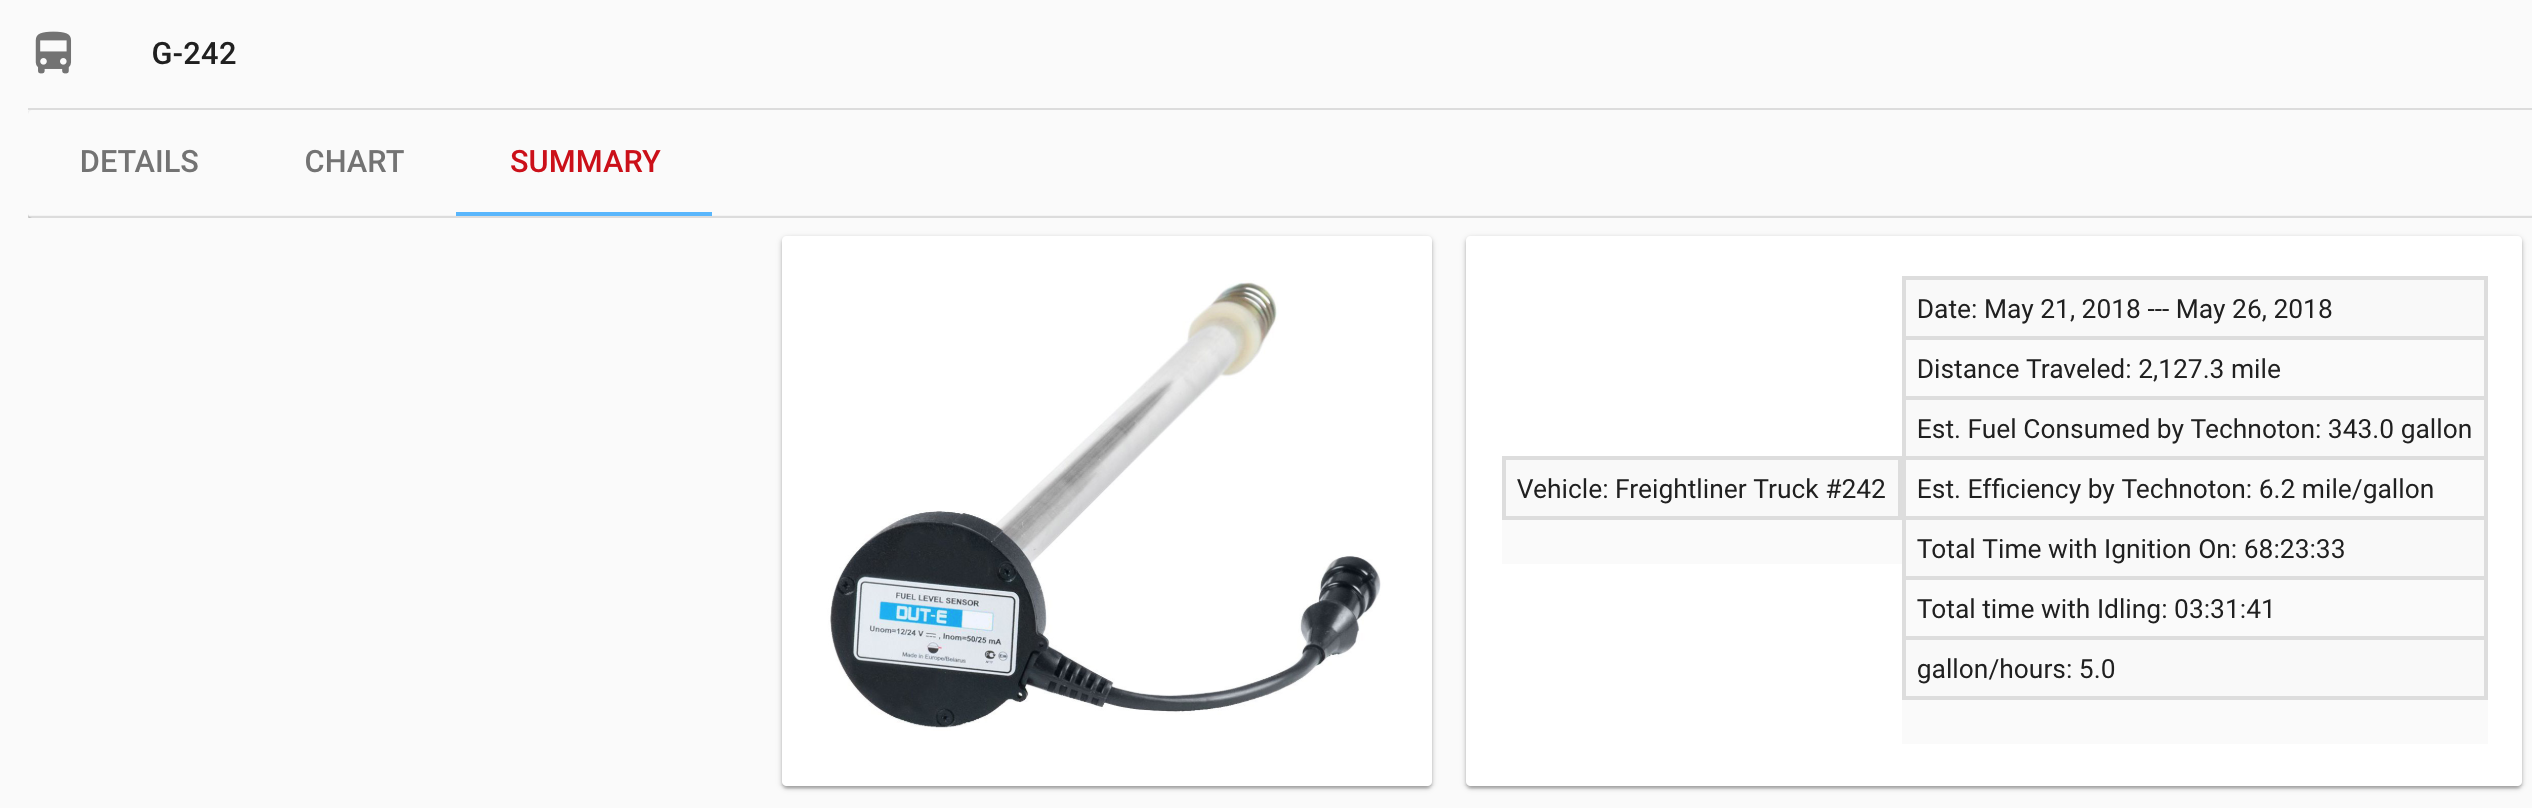
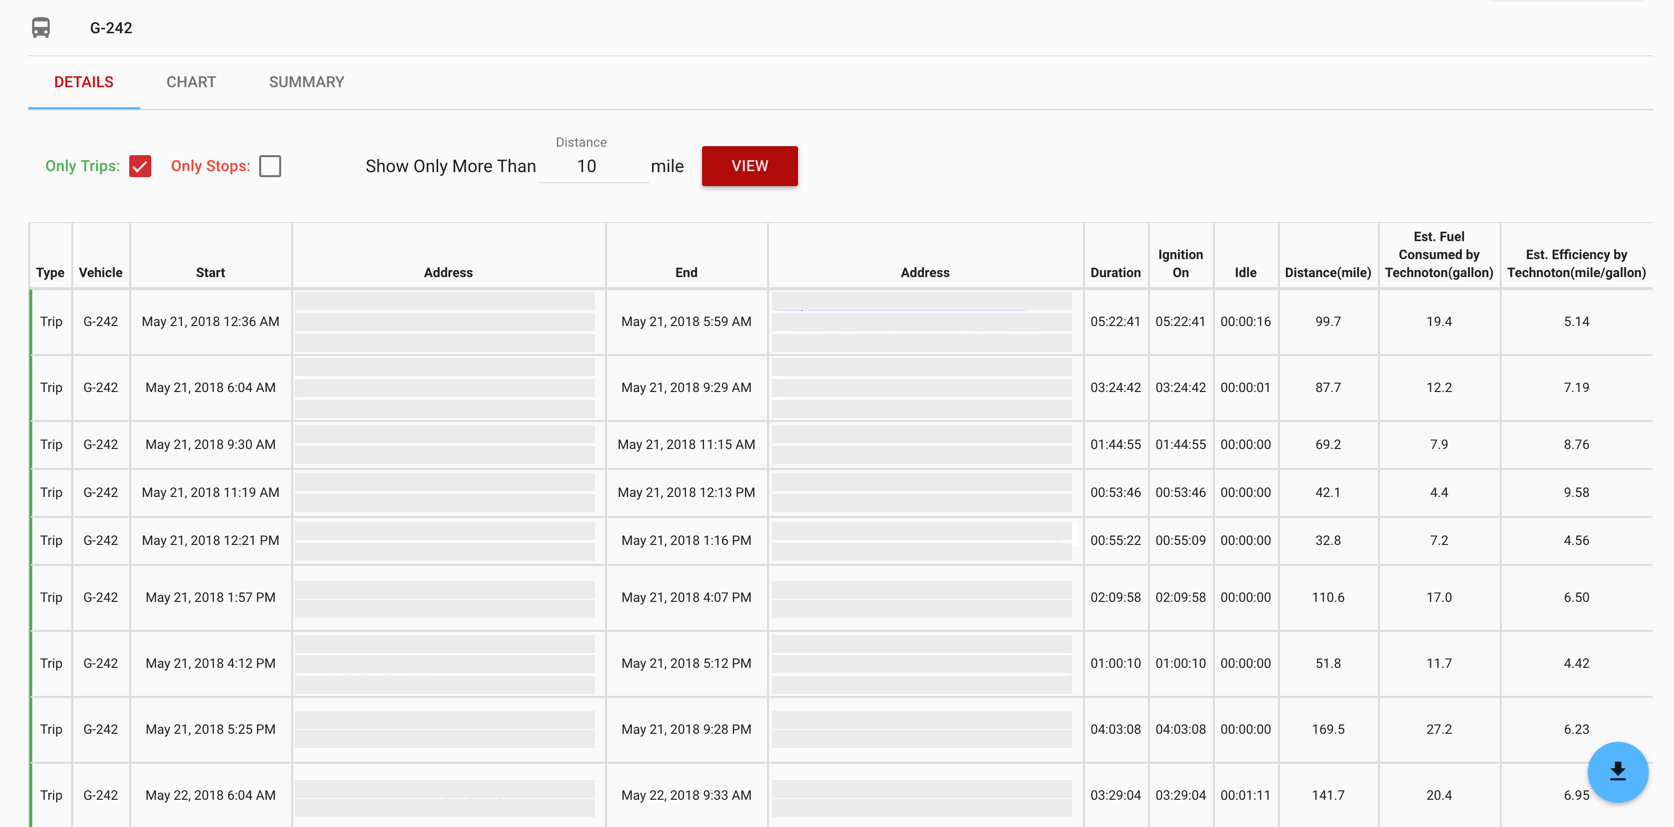
 Mobileye
Mobileye is a camera that can alert you if you are swaying too close to the side of the lines marked on the road, and even let you know when you are too close to the vehicle in front of you.
With this report you get a look at how many departure warnings or Headway warnings your vehicle generated over any period of time.
Schedule this report to get an idea if your drivers are improving on a weekly/monthly basis.
 Satcom
The Satcom report shows you the places where your device reports when there’s no network/cellular coverage, it requires a special accessory that’ allows communication with satellites for communication instead of cell phone towers.
Trip Analysis Reports
Trip Analysis Reports analyze the behavior of vehicle’s and capture important metrics that are derived from two main factors, a vehicle’s distance and ignition time.
Depending on the report you’ll have a summary of these two factors under different scenarios.
Some things to keep in mind when looking at the reports:
- Distance calculations are done in 3 main ways
- 1. Device priority – this means that the devices are the ones calculating the distances internally, and an accumulated value is reported whenever the device reports an event
- 2. Gateway priority – this means that Pegasus is calculating the distance traveled based on the GPS coordinates of each event
- 3. ECU priority – this value is read from the vehicle’s onboard computer engine and represents what’s on the vehicle’s overhead dashboard. This requires a physical connection to the vehicle’s engine either via an accessory like with the ECU monitor, or a Syrus 4 device.
- Ignition calculations are done in 2 main ways:
- 1. Device priority – physical wire connected to the vehicle’s ignition
- 2. ECU priority – the engine hours are read from the vehicle’s onboard computer
![]() Note if the wire is connected to the wrong location in the vehicle’s ignition detection or if the wire breaks at some point it will lead to inconsistencies in the ignition duration and any derived calculations
Note if the wire is connected to the wrong location in the vehicle’s ignition detection or if the wire breaks at some point it will lead to inconsistencies in the ignition duration and any derived calculations
 24hr Detailed
See a detailed location report of where your vehicle has been in the last 24 hours. Schedule this report to generate daily and be sent to your email.
Features
- Quick and easy to use
- Schedule to arrive daily to have a snapshot of your vehicle’s past 24hrs of activity

 Events in Zones
See the special events that generate in a particular geofence or zone. This is useful for knowing where your inputs or outputs activated inside a region. Or in which zone your speeding events occur more often
This report requires that you have a geofence already defined in the system. It asks you to filter by the name of the event that generated. Events are any action that the vehicle reports, such as excessive idling, speeding, ignition turned ON/OFF, etc.
Features
View events generated by vehicles within geofences.
Filter events by code or label you want to include in the report, as well as hours by a time range.
Include geofences or collections that you are interested in viewing the events.
Requirements
- A geofence is required to generate the report
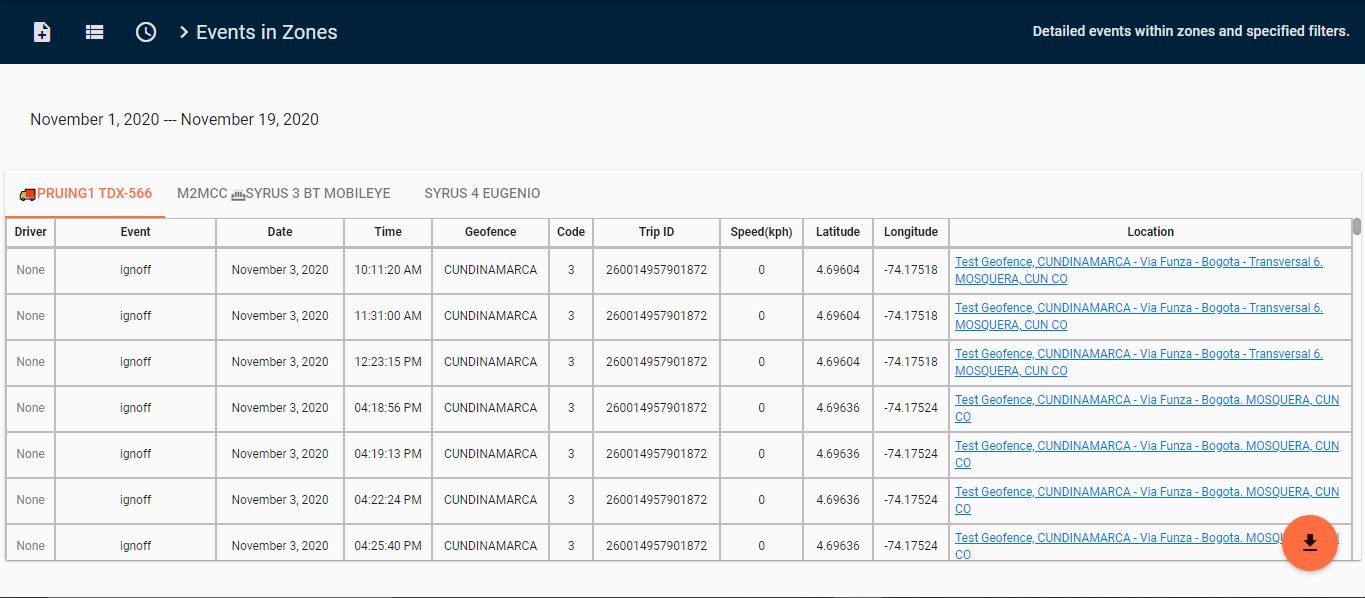
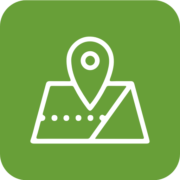 Trip Analysis Between Geofences
Given a base and many destination fences, see if your drivers are arriving at their scheduled drop off locations, and how long they spend there.
The usual setup of this report requires that you define a single base, and many destination fences, you can also select collections or groups of fences as destination.
For example you could select your fleet and have the base fence be “Central Warehouse”, and the collection be called “Floral Shops”, inside of Floral Shops there’s several stores or geofences for the different shops. The report would tell you at what time the vehicle left the Central Warehouse, if it visited any floral shops at what time, and how long the driver spent in each floral shop.
Features
- Travel and stop information to and from any selected geofence
- Shows geofence exits and visits to different fences until reaching the base geofence again
- Fuel consumed per trip between geofences: the amount of fuel consumed per trip is based on the accessory connected to the unit (ECU Monitor / Technoton Fuel Rod).
 Complete Event Details
The complete event details report features an indepth look at all the events reported by the devices from any time period.
- Detailed report for all events for the selected vehicles
- The report can filter columns, which allows us to focus on the information we require.
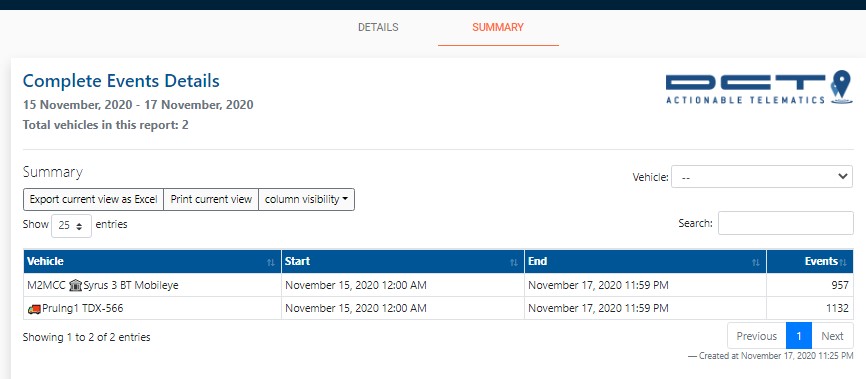
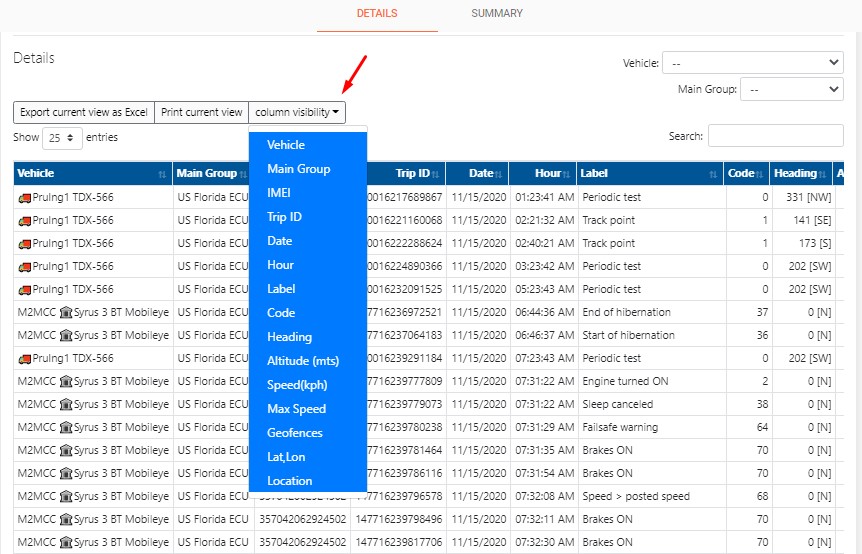

 Trips
Trips
The trips report provides you a general overview of the places where your vehicle traveled from and to. Depending on how your trips are configured you will notice that some stops are actually the vehicle idling.
Features
- Analyze any trip information that your fleet have made at all times
- Trip duration
- Total time with engine On / Off
- Total time while idling – idling is when the vehicle is left with the ignition ON without moving, this time starts counting after 3 minutes of detecting this condition.
- Total time while speeding – the speed threshold is defined in the configuration parameters of the device, this time starts counting the second it goes above that speed limit.
- Estimated fuel consumed – the amount of fuel consumed is estimated based on the efficiency parameter that is written in the vehicle’s description.
- Real fuel consumed – the amount of fuel consumed per trip is based on the Engine Control Unit accessory that’s connected directly to the onboard computer of the vehicle

 Vehicle and Driver Activity
This report gives you a breakdown of the activity performed by both your vehicle’s and drivers. It provides you with a summary of the trips each driver performed, and how their metrics compare, including: Durations, Max values, & Incidences.
Incidences are calculated as the number of times:
- Speeding – the vehicle spends 10 seconds continuously over the speed limit. (Note that there’s only a single speed limit threshold established for this incidences amount)
- Idling – the vehicle spends more than 10 minutes with the engine ON and the vehicle has not moved.
- OverRPM – the vehicle spends more than 10 seconds continuously over the RPM threshold (note that this requires the ECU accessory)
- Braking – the vehicle brakes aggressively (~-0.6g)
- Acceleration – the vehicle accelerates aggressively (~+0.6g)
There are many ways to identify yourself as a driver, such as:
- iButton
- RFID
- Taurus App
- Bluetooth tag
Contact an administrator to figure out the best and most effective way for your drivers.
Features
- View a summary of vehicle and driver trips, duration of counters, the limit and max speed, and the amount of incidents
- Includes a detailed view of the driver’s trips
Requirements
- The RPMs column requires the ECU monitor accessory or a Syrus 4G
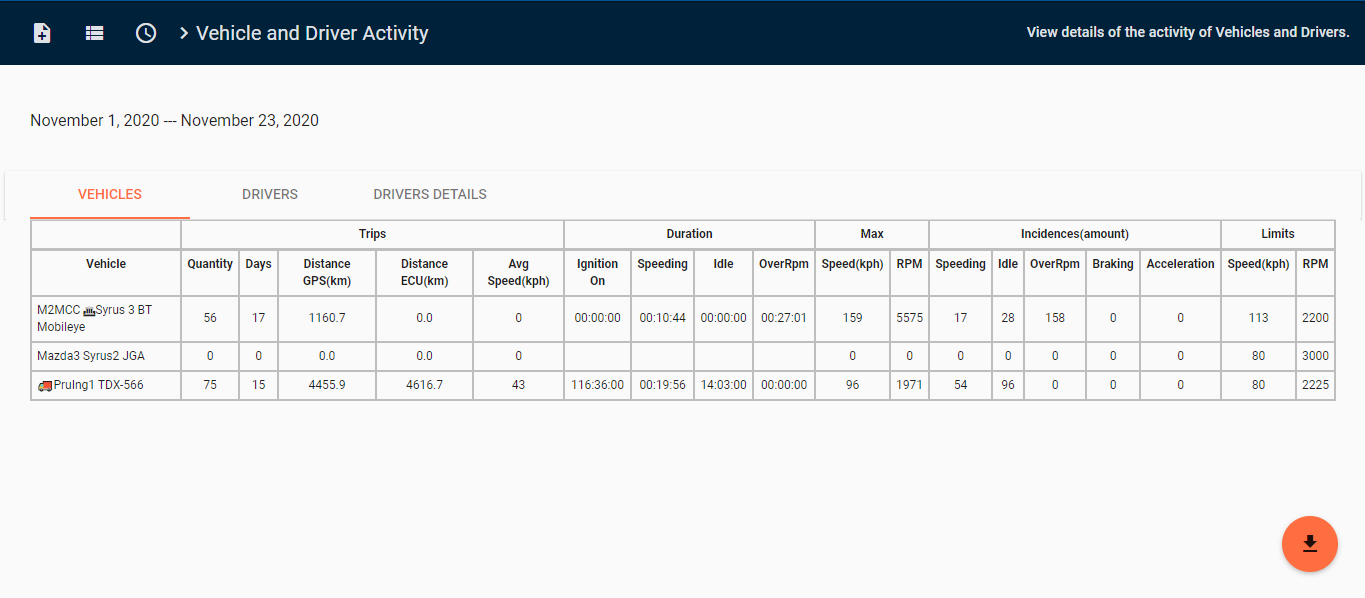
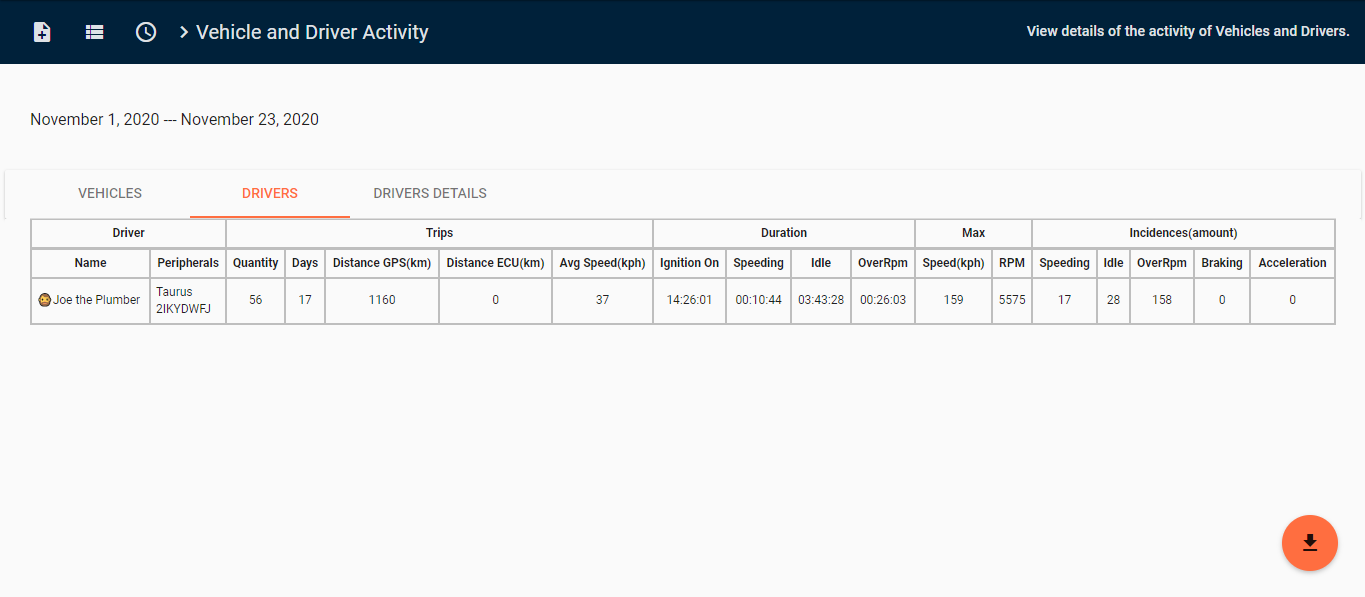
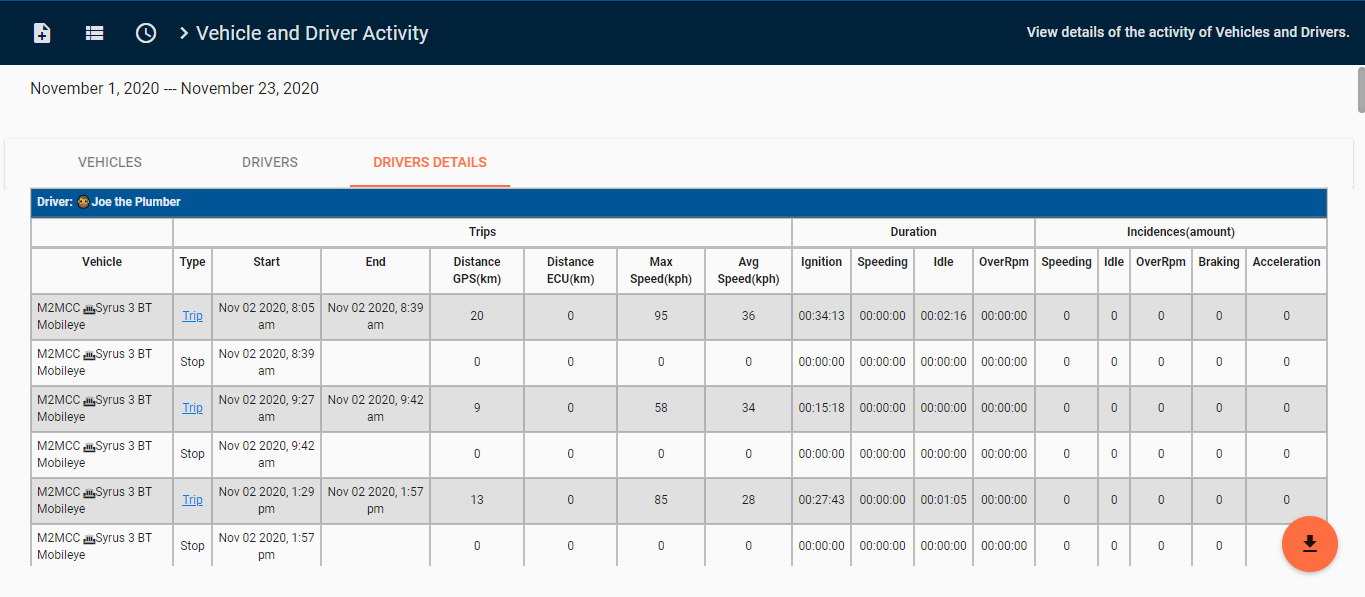
 Daily Entity Summary
The daily entity summary report features an overview of the durations that each vehicle spent with the ignition ON and distances driven.
Features
- View driving, idling, stop and total time
- View summary of your fleet daily activity per entity.
- View when and where the vehicle start/end the activity of the day.
- Includes distances traveled by the device and ECU (if available)
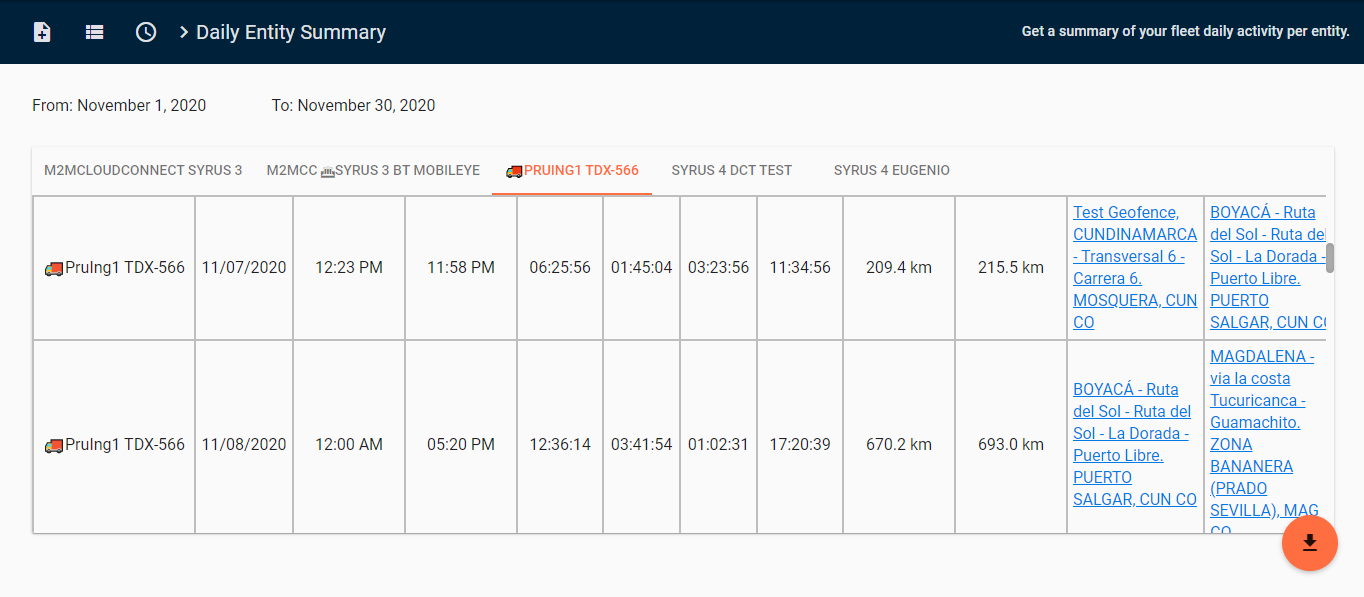
 Activity Details
This report gives you an indepth look at all the activity performed by your vehicles and drivers. It provides you with a summary of the durations, max values, & incidents that occurred at any time. This report is also compatible with the speed limit property for geofences, so you can find out which vehicles went over a specific speed limit for a specific geofence.
The incidents are calculated as the number of times:
- Speeding (normal) – the vehicle spends X seconds continuously over the speed limit (this value is editable on the configuration of the device)
- Speeding (geofence) – the vehicle goes over the speed limit established in the property of the geofence
- Aggressive driving – this is configured on the device as a fixed amount of force that must be passed to trigger the event
- Idling – the vehicle spends more than 10 minutes with the engine ON and the vehicle has not moved.
- Hard Braking – the vehicle brakes aggressively (~-0.6g)
- Harsh Acceleration – the vehicle accelerates aggressively (~+0.6g)
- OverRPM – the vehicle spends more than 10 seconds continuously over the RPM threshold*
- Coast – the vehicle is experiencing high speeds with low rpms*
- Engine braking*
* Note that these incidents require the Syrus 4G or an ECU monitor Accessory
There are many ways to identify yourself as a driver, such as:
- iButton
- RFID
- Taurus App
- Bluetooth tag
Contact an administrator to figure out the best and most effective way for your drivers.
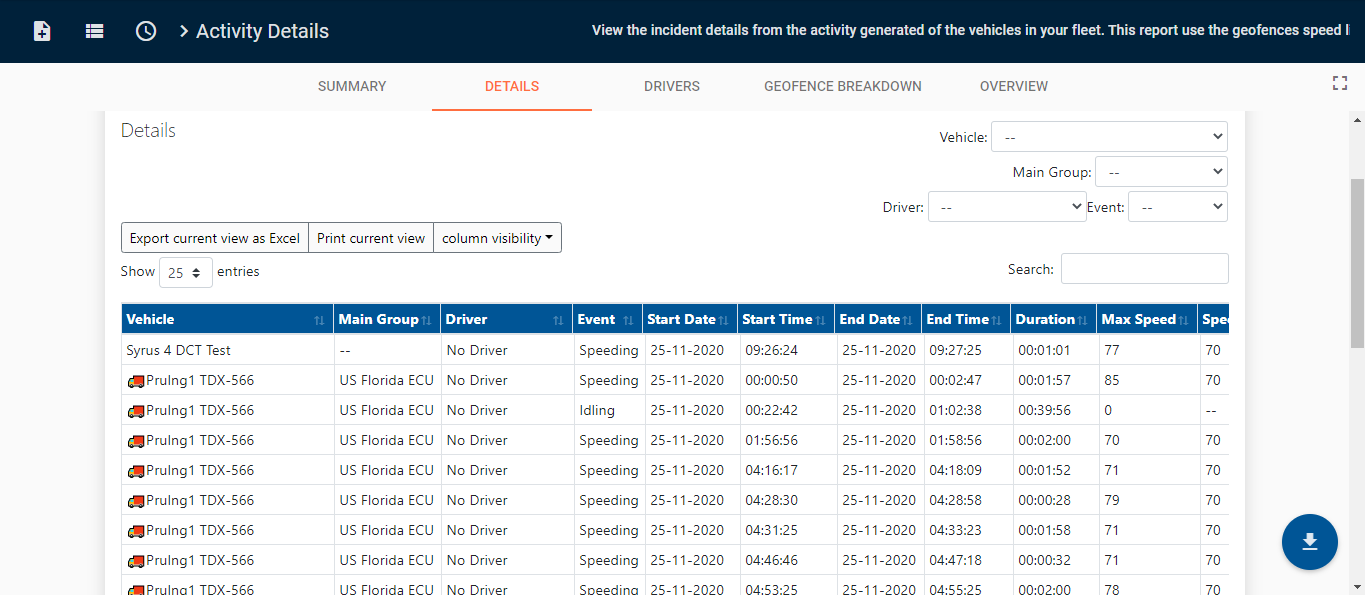

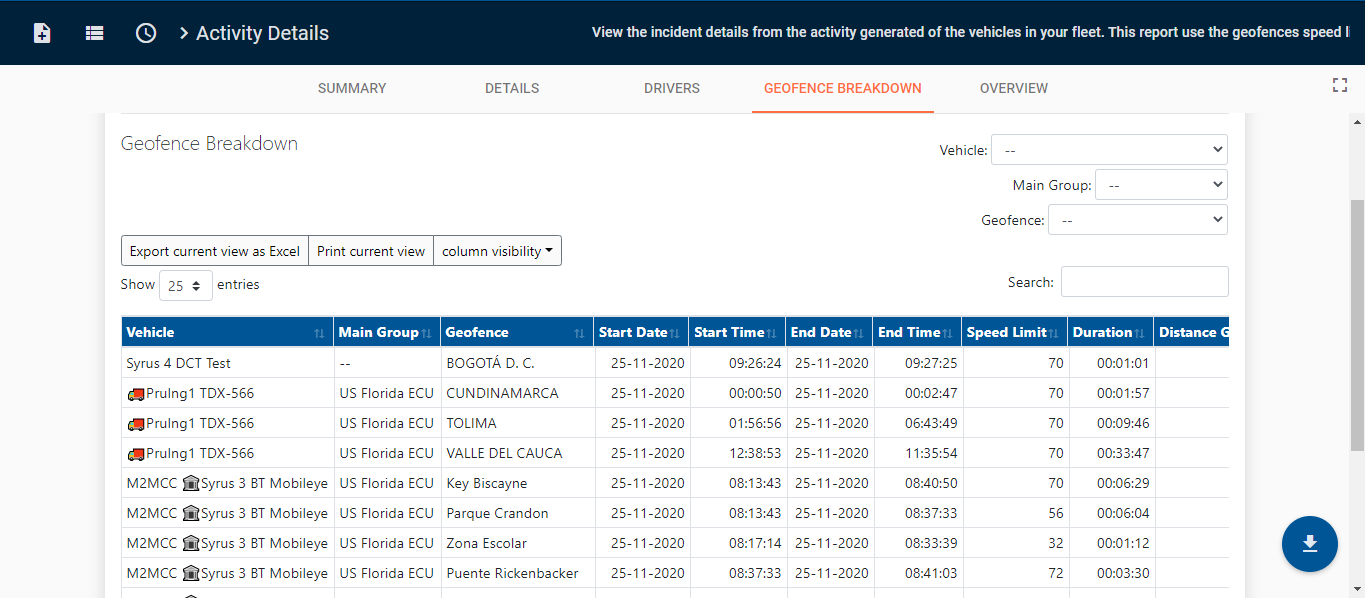
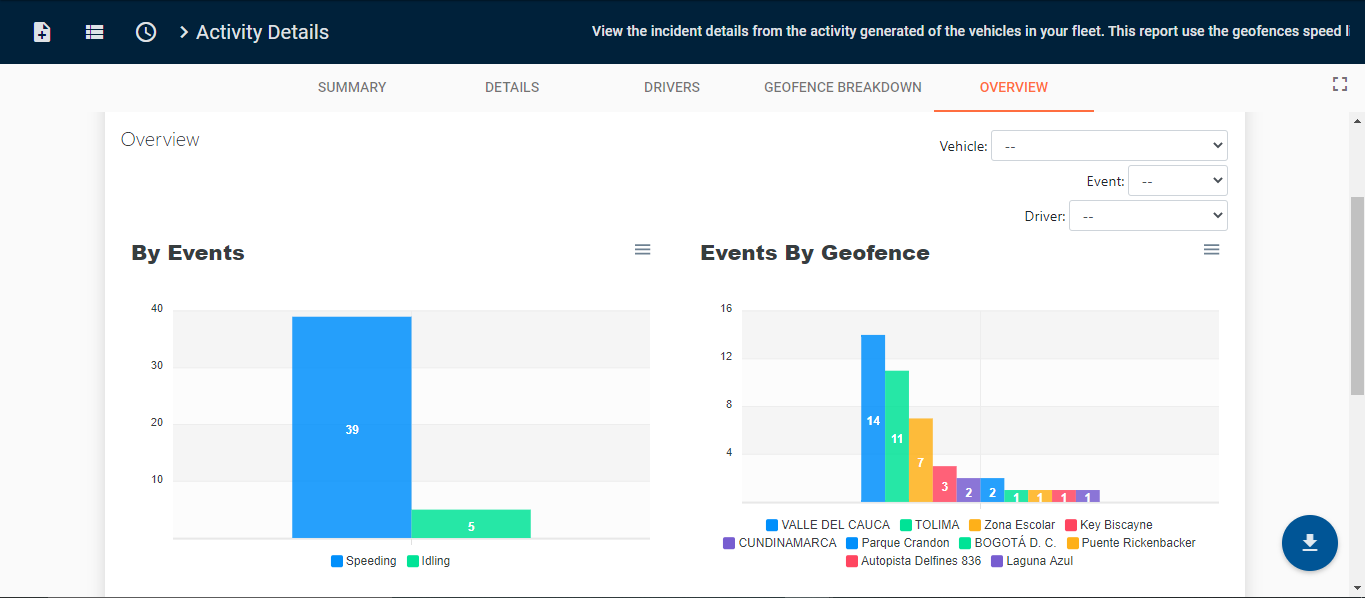
 Visits (Permanence)
The visits report tells you where you’ve been and for how long. It looks at the locations or geofences you’ve defined in order to make a report of the places you’ve visited.
Features
- View a vehicle’s duration inside one or more geofences, number of visits and more relevant information when the vehicle was inside the geofence.
- Can include passthrough when a vehicle is moving inside the fence for at least one minute.
- View the detail of the visit to the geofence and the summary of the vehicles in the collection of geofences.
Requirements
- A geofence is required to run the visits report

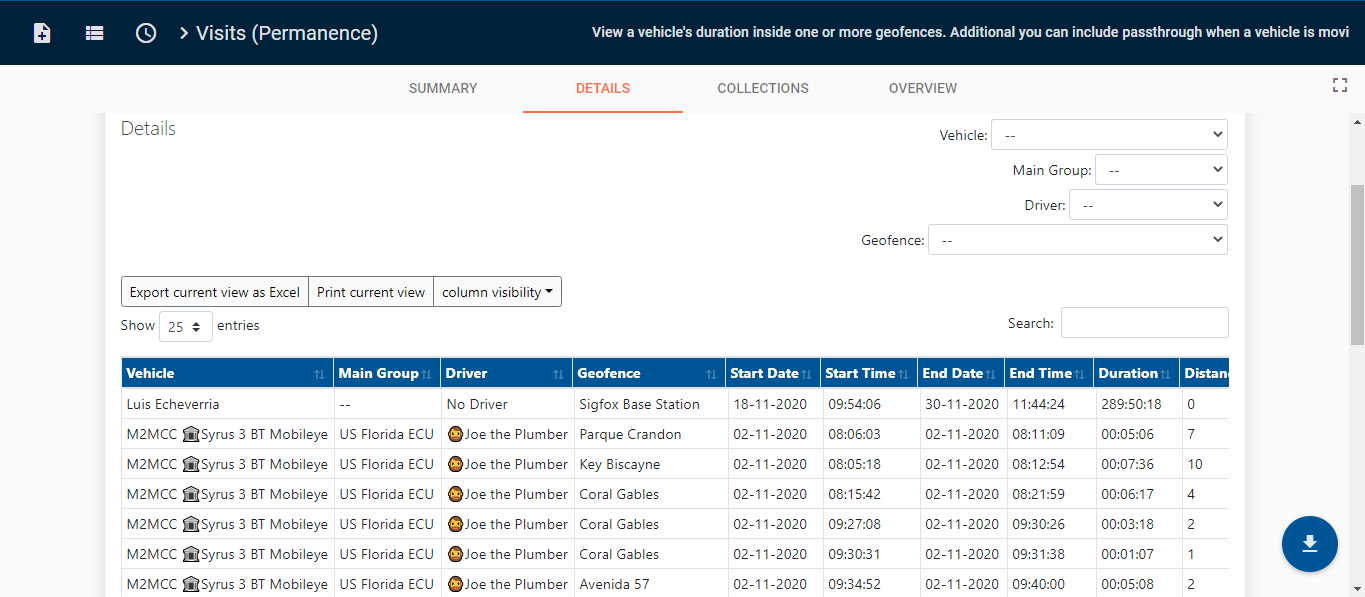
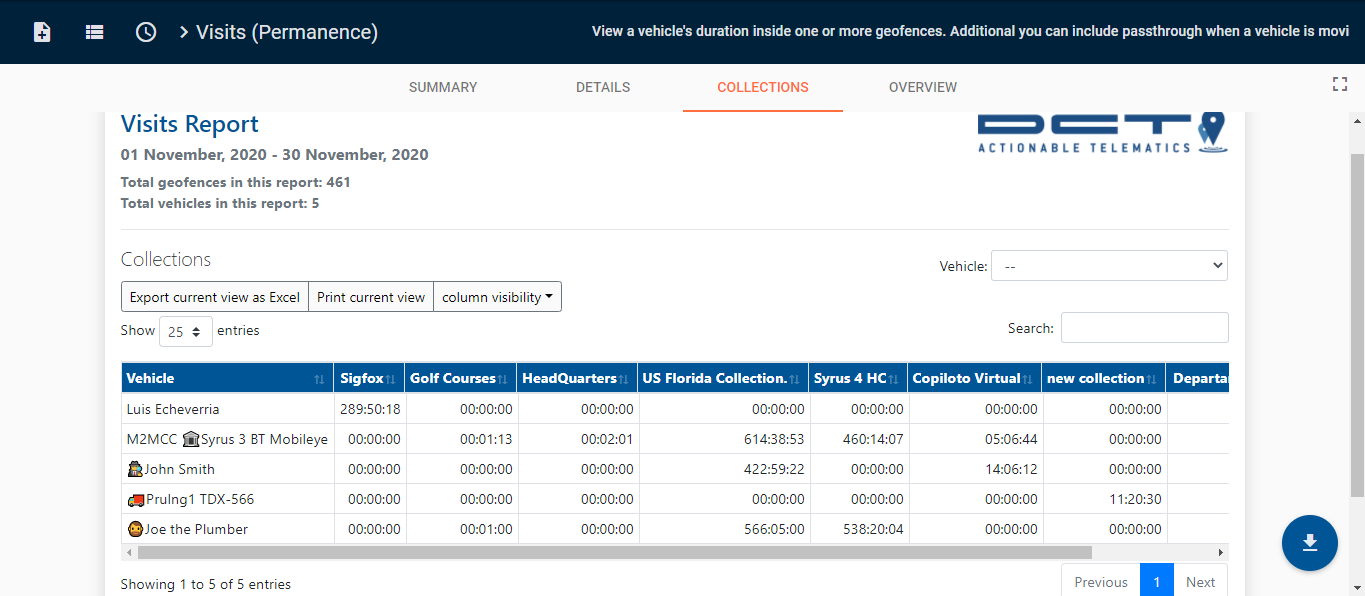

 Fuel Consumption
Shows a per-vehicle summary of the fuel sensor along with the amount consumed, fill-ups, efficiency, and other metrics.
FEATURE
- View a summary of the fuel consumed per vehicle, distance traveled in miles, the number of fuel fillings, and the average efficiency.
- Includes a detailed view of the vehicle’s fuel consumption.
- Show the fuel loss and the possible fuel theft.
REQUIREMENTS
- The vehicle must have fuel-related sensors configured.
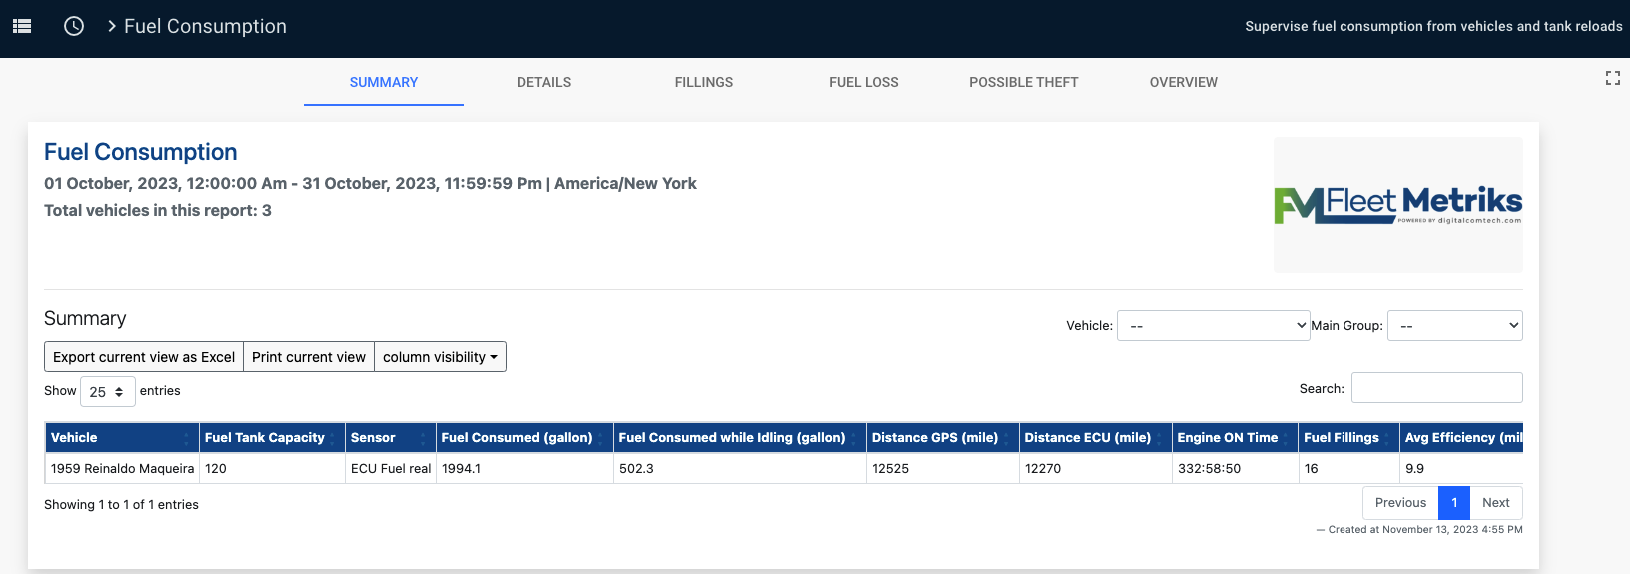
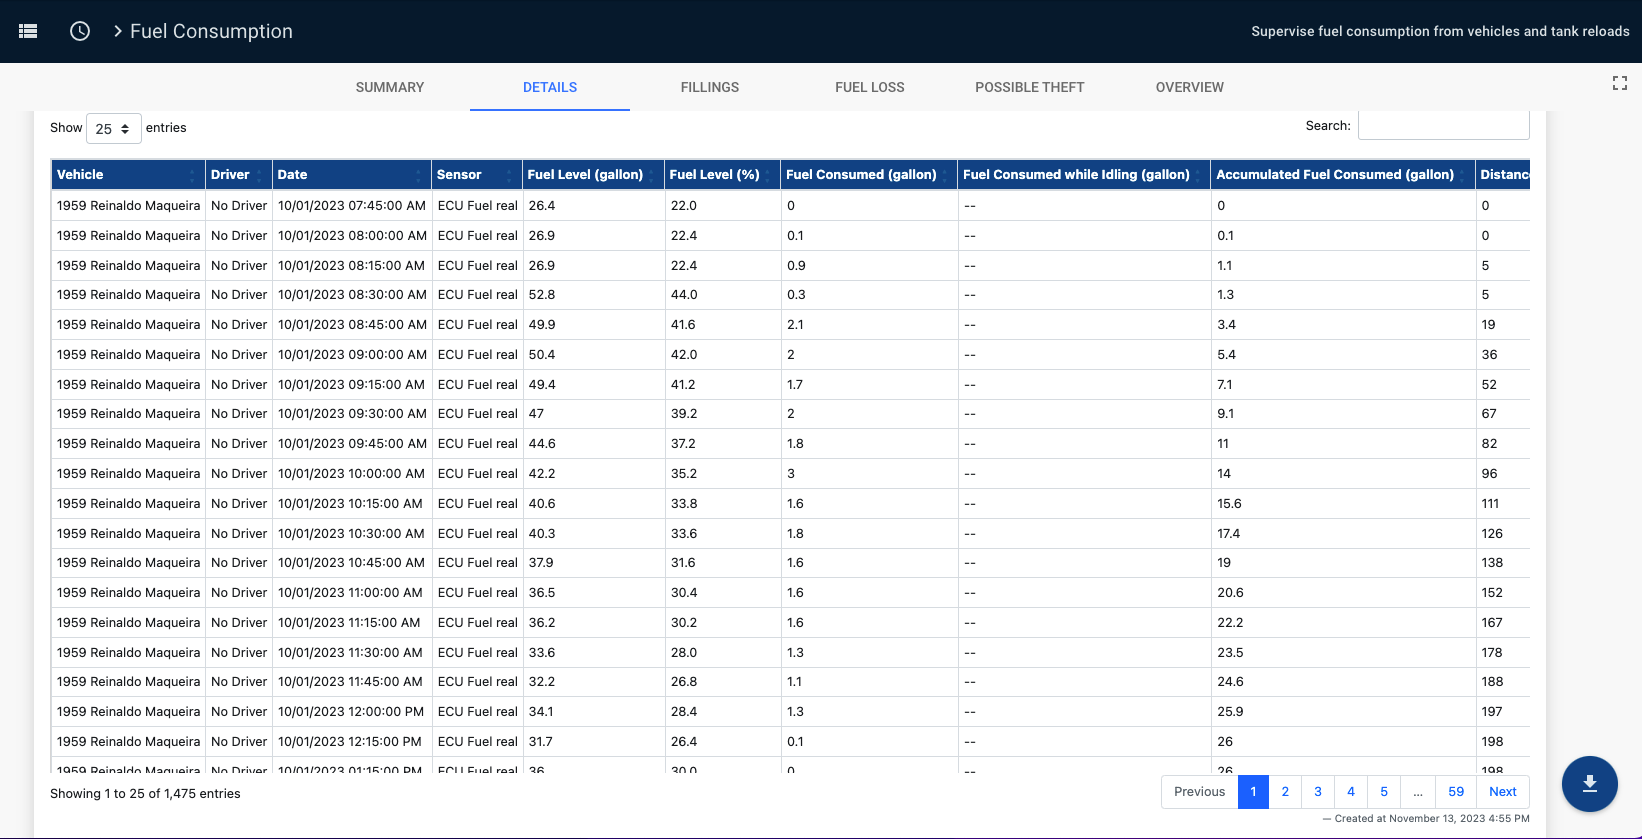
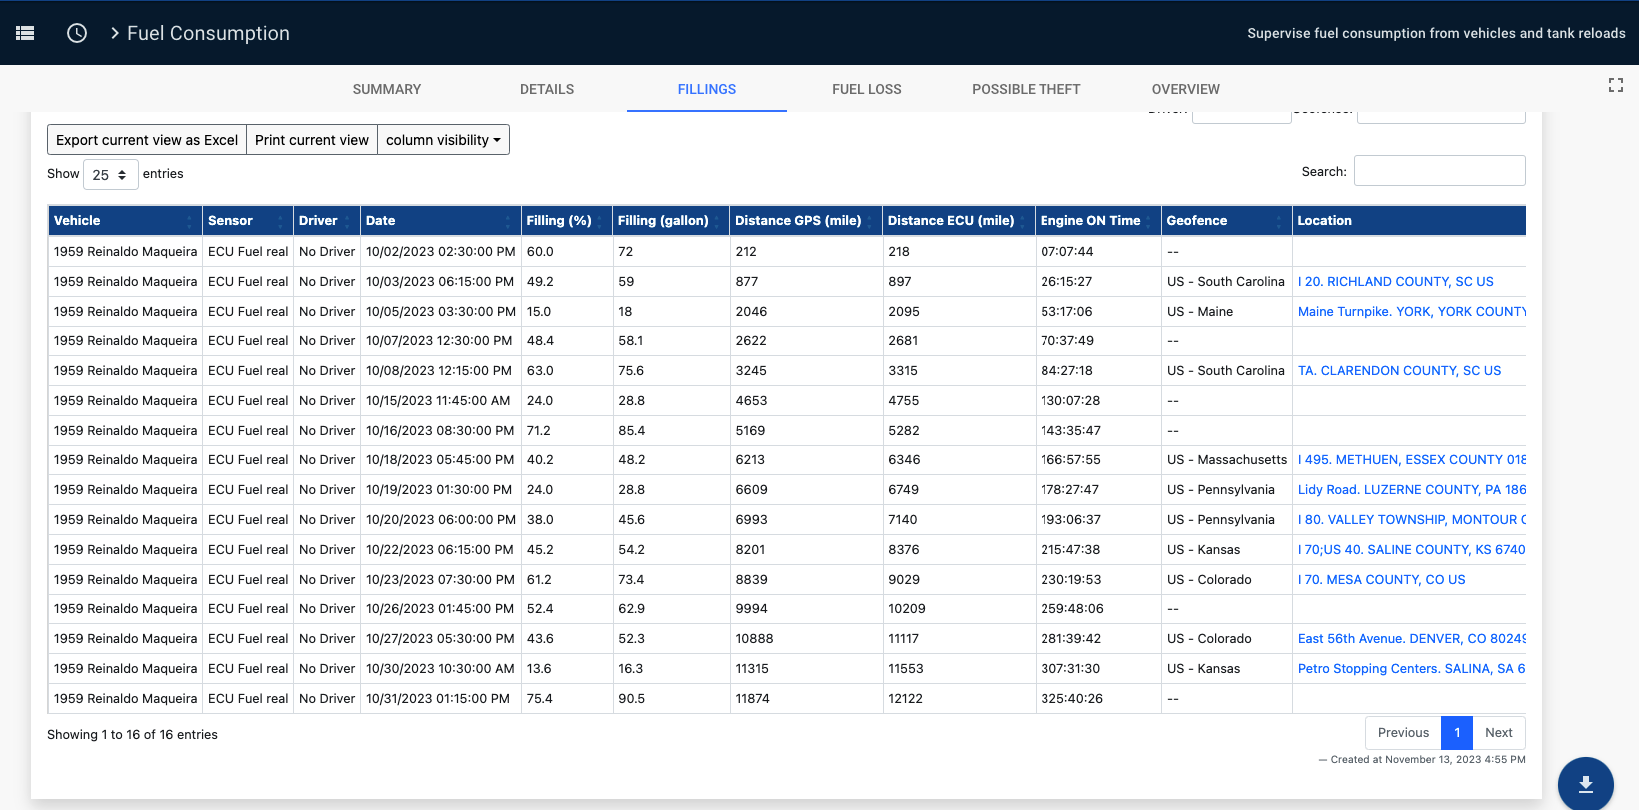
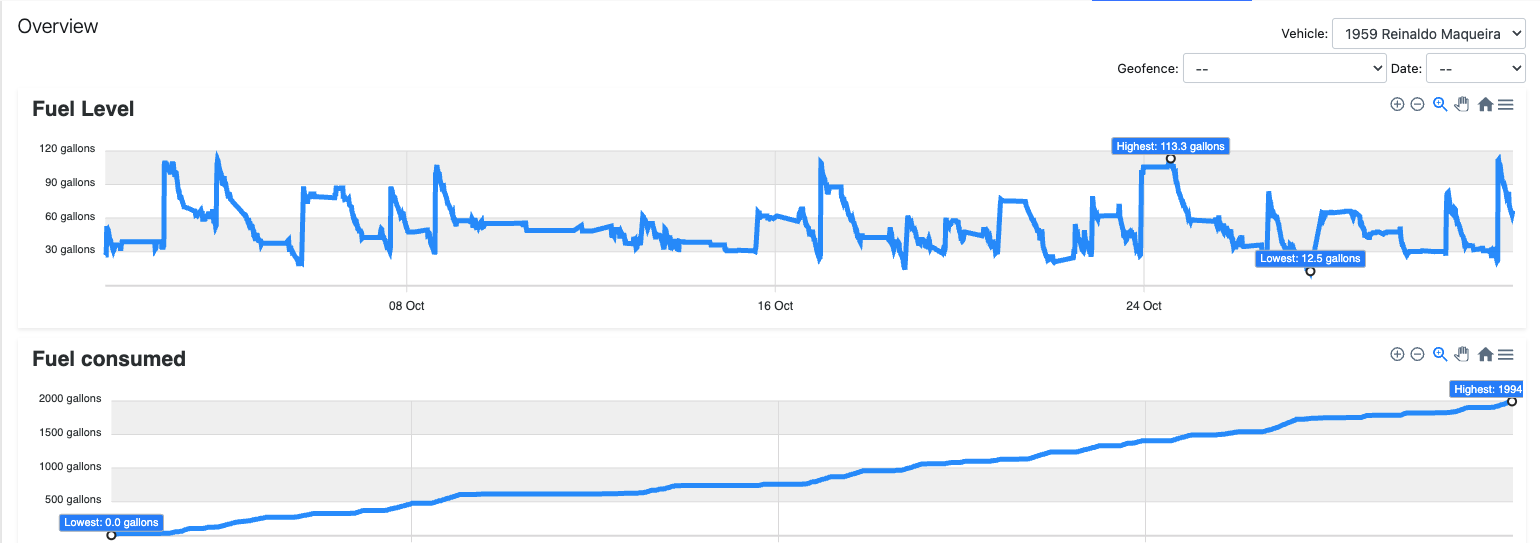
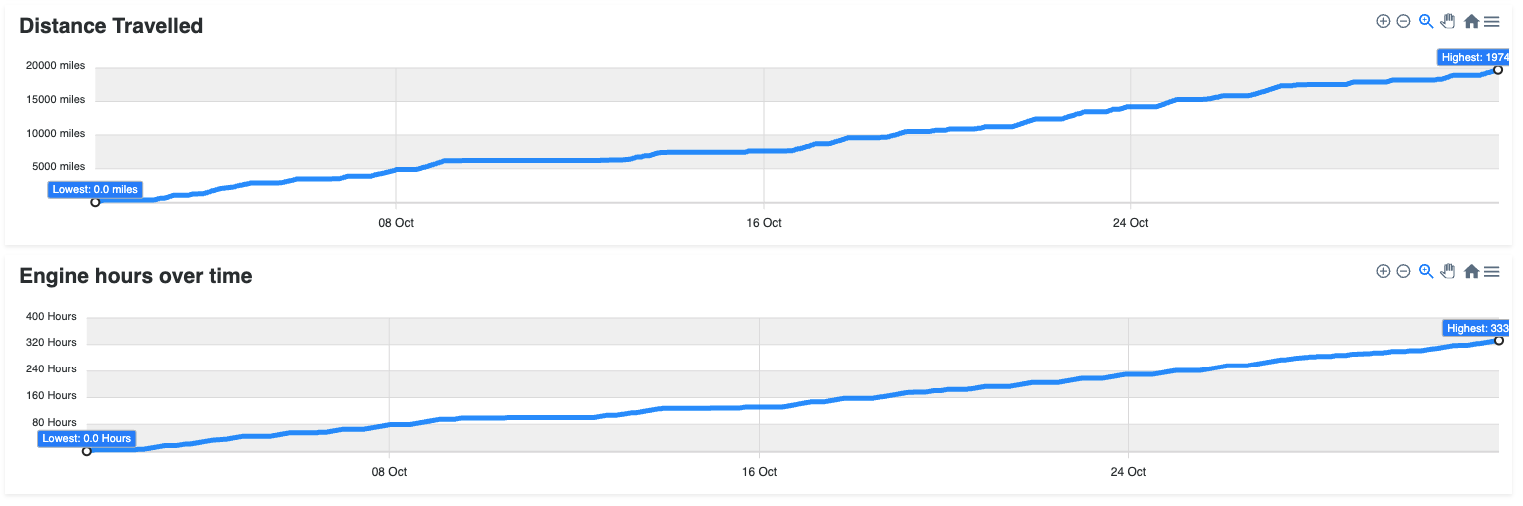
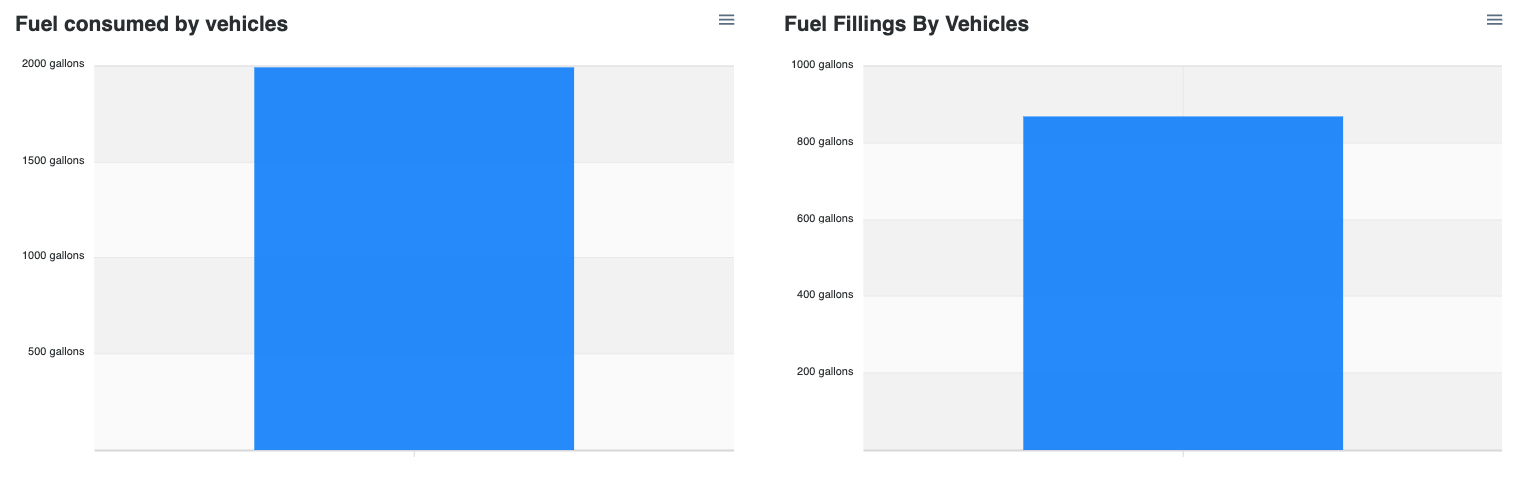
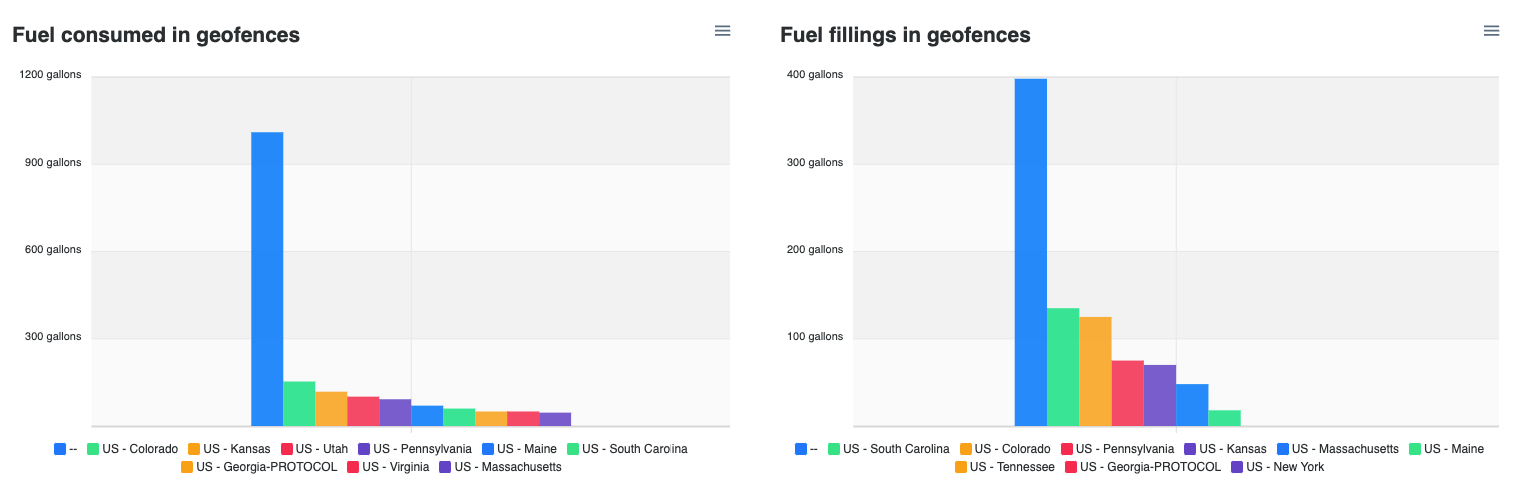
Fuel Loss
Fuel loss occurs when the following conditions are met: 15% greater than or equal to when the ignition is on, the distance traveled is less than 1km and the time range is less than or equal to 35 minutes.
Fuel Theft
Possible fuel thefts occur when the following conditions are met: 15% greater than or equal to when the ignition turns on again.
*Additional* – changes in the odometer with any fuel loss (independent of the ignition).
 Daily Counters
Analyze the daily metrics for your entire fleet quickly, including the distance driven, time spent driving, idling, and speeding. If you have an ECU monitor you’ll be able to see how much fuel you consumed and wasted idling.
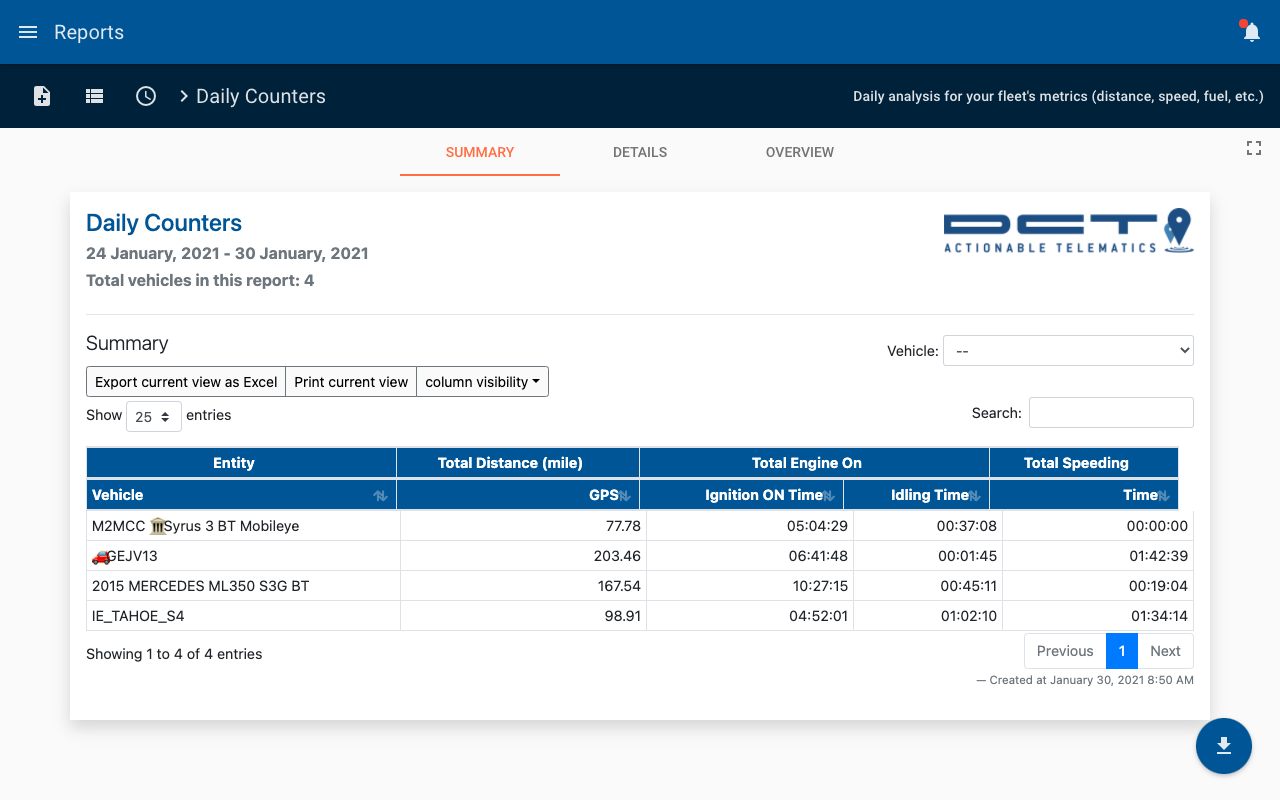
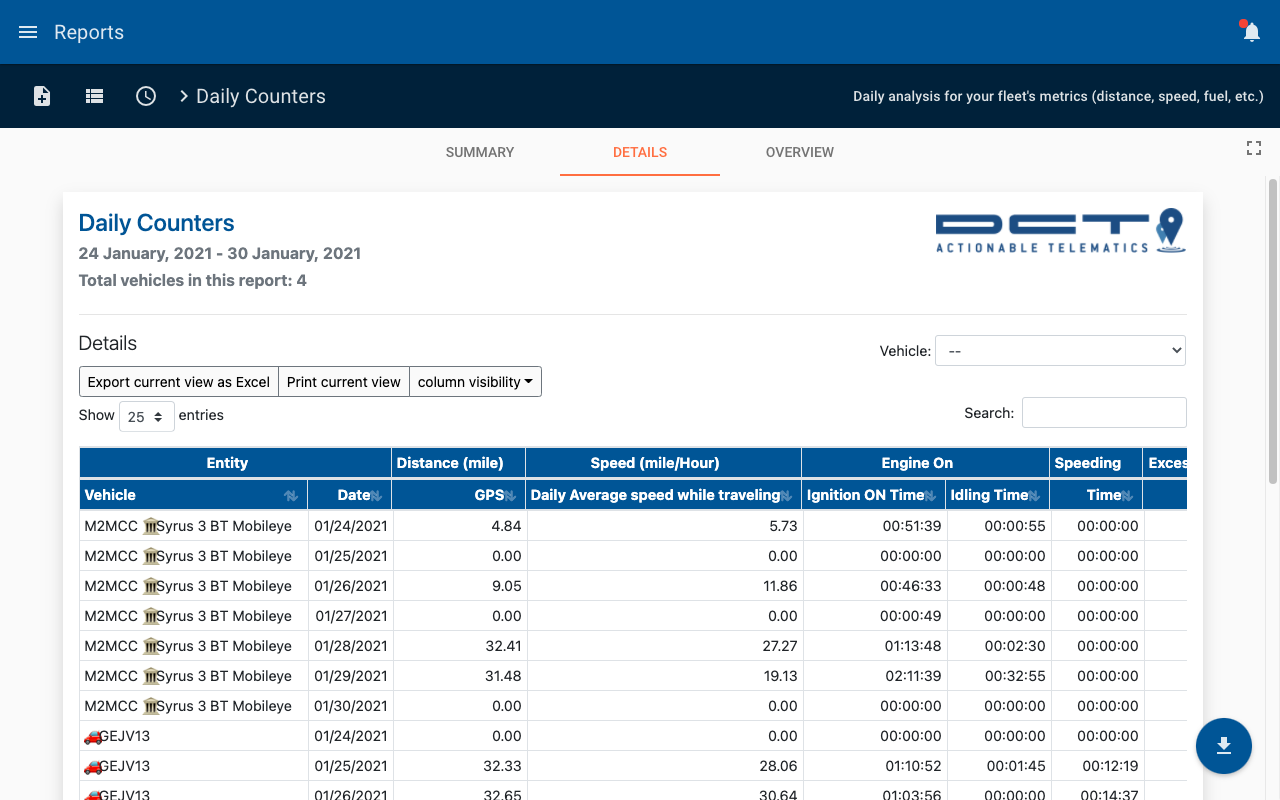
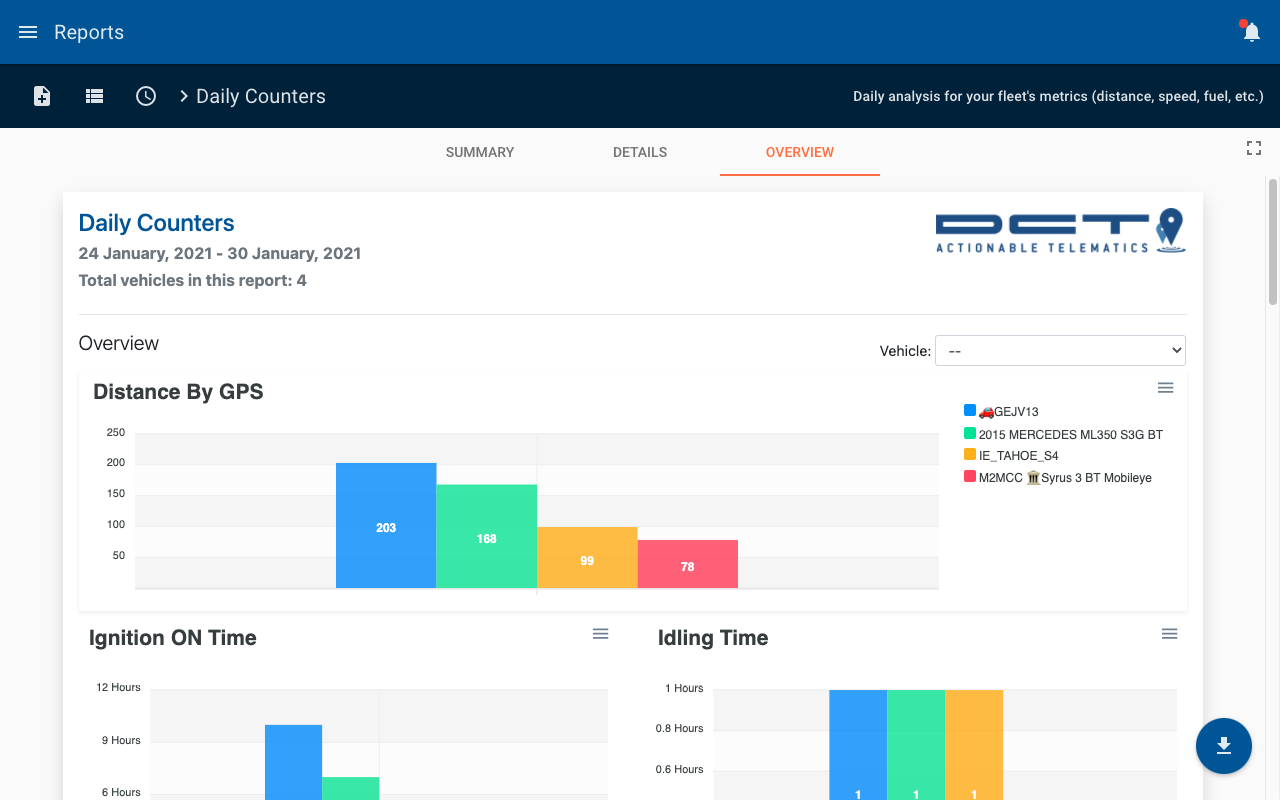
 Distance/Time – Fuel Cost Estimator
This report gives you an estimated fuel consumption based on the distance driven or the amount of hours your engine’s running, this estimated cost is calculated from the fuel efficiency that is entered in the vehicle’s information in the Organization menu. Contact your administrator for help with this if you’re not able to see the estimated fuel consumption.
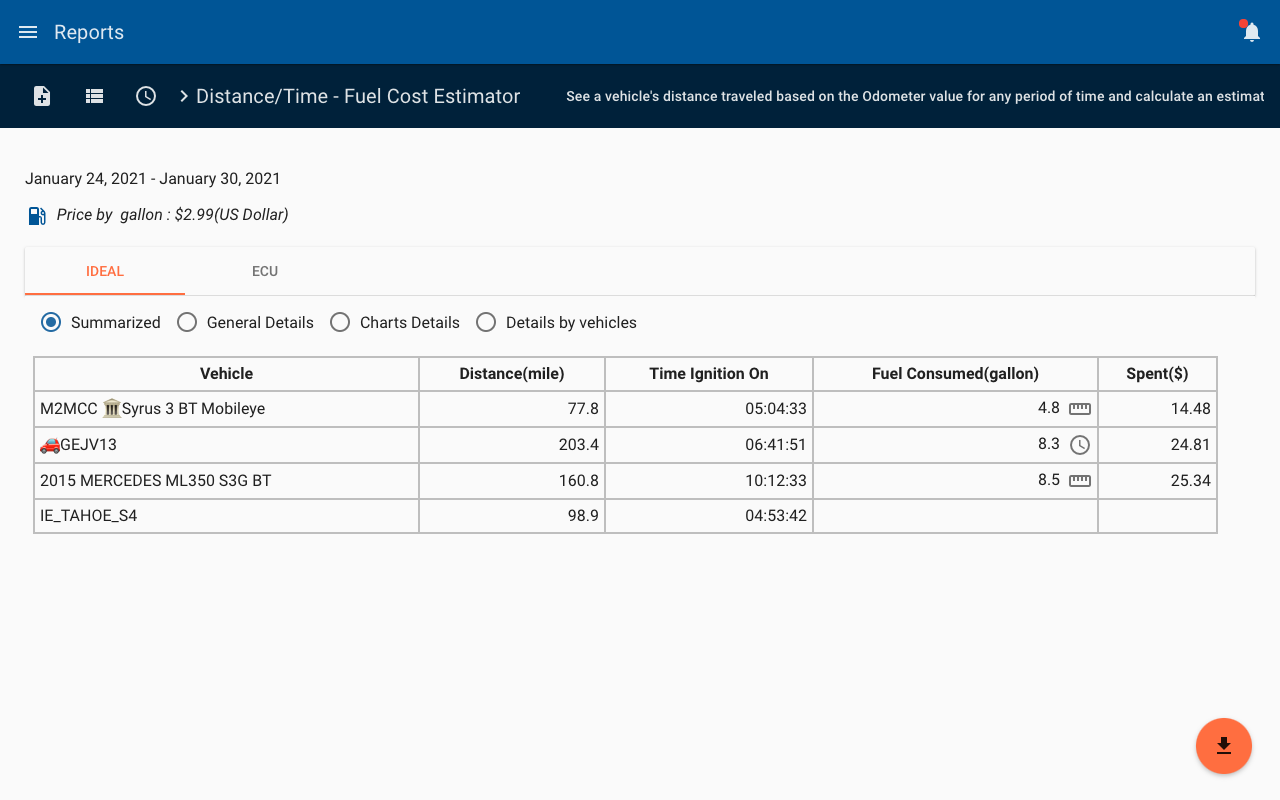
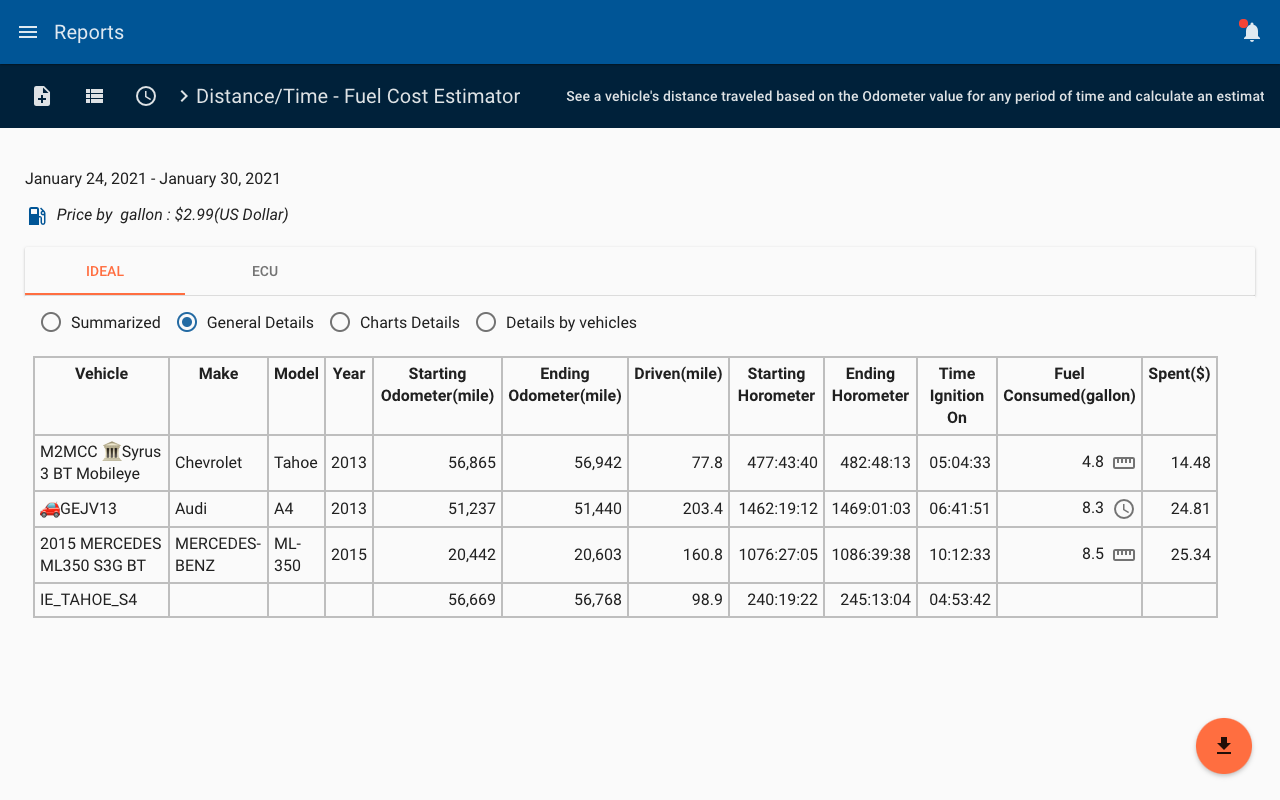
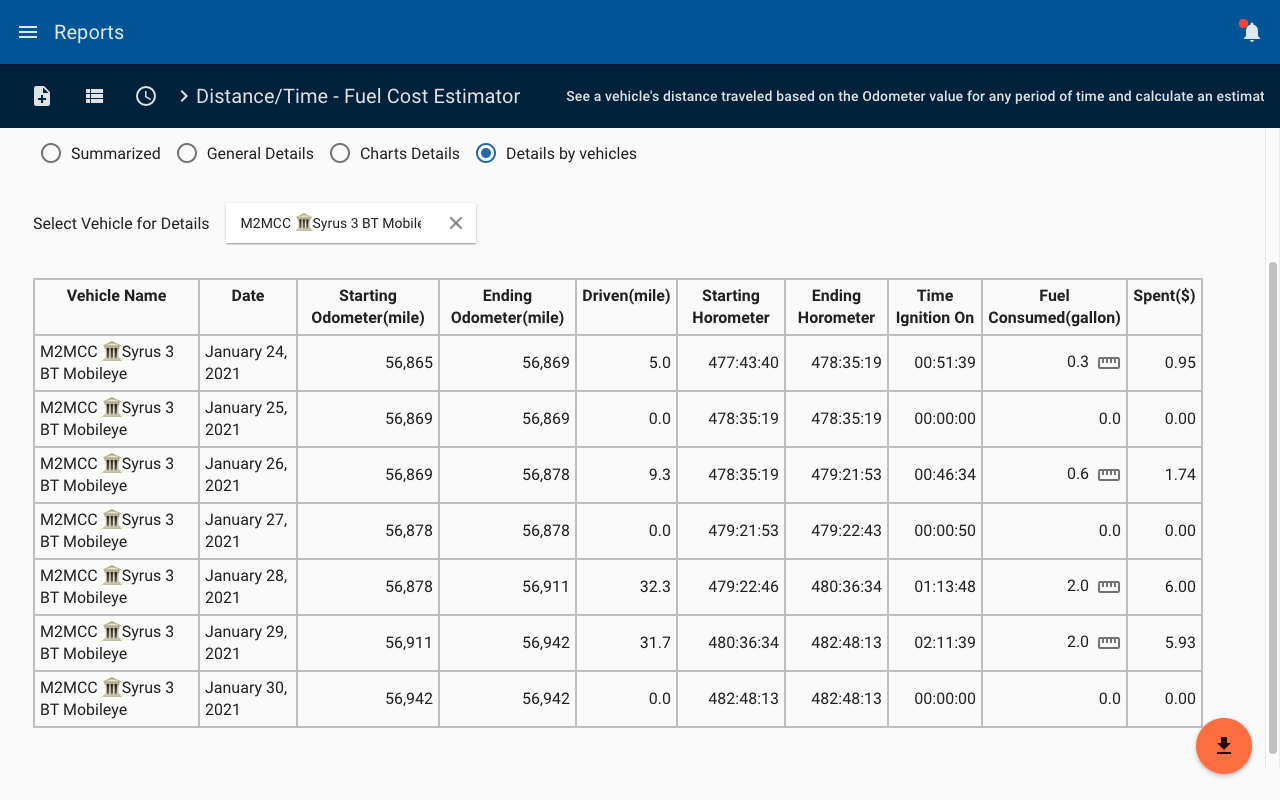
 Engine Stats
The engine stats report takes a look at the important parameters that your truck reports, it requires an ECU accessory, but with it you’ll be able to get information on the initial and final odometer values, as well as the total time with the ignition On and time spent idling.
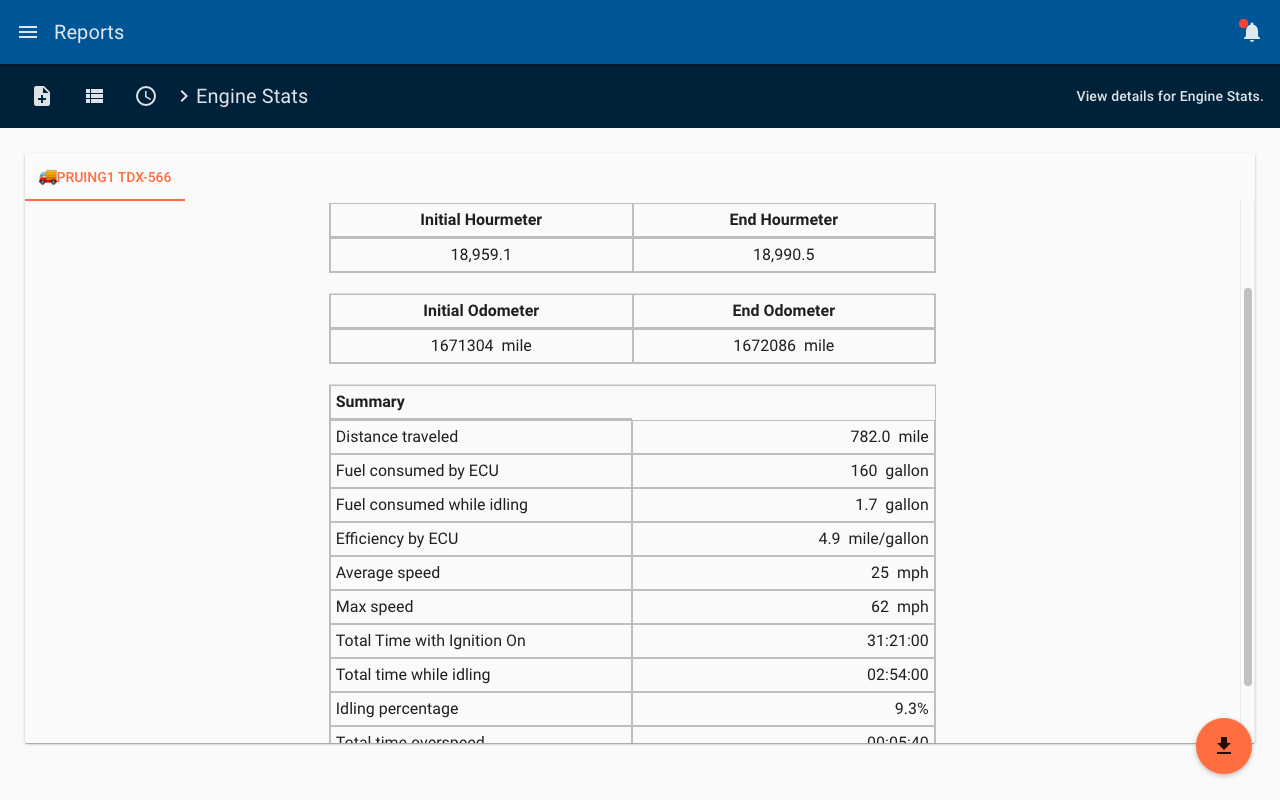
 Engine Usage
The engine usage report gives you a quick rundown of the amount of time your fleet spent with the ignition ON and idling. Idling is calculated after 3 minutes of the ignition ON without movement.
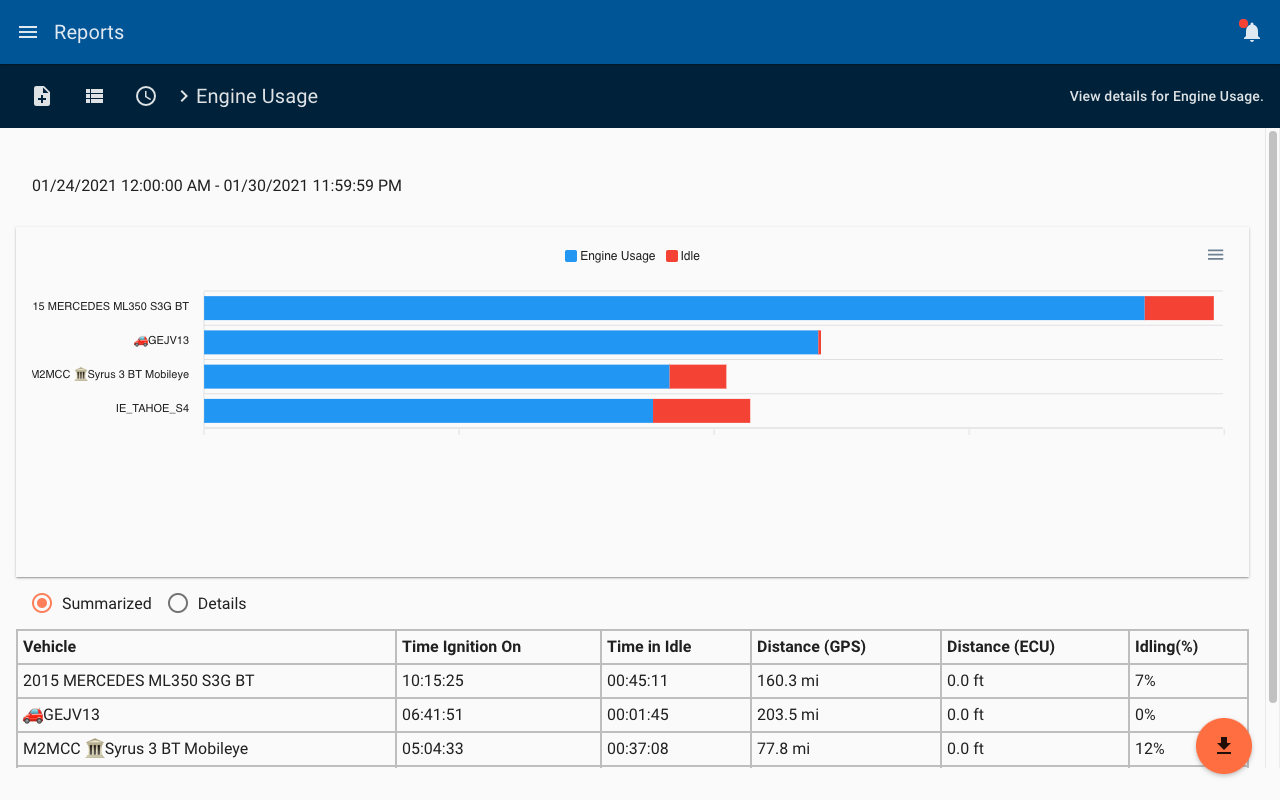

- Events Count
The events count report gives you the number of times an event generated for your fleet. It can be used to find out how many times an input was activated, to know how many panic alerts fired for a given vehicle over a week, for example.
 Idling
The idling report gives you an overview into where your vehicles spent the most time idling and for how long. It can be scheduled to be sent automatically to your email address on a weekly basis.
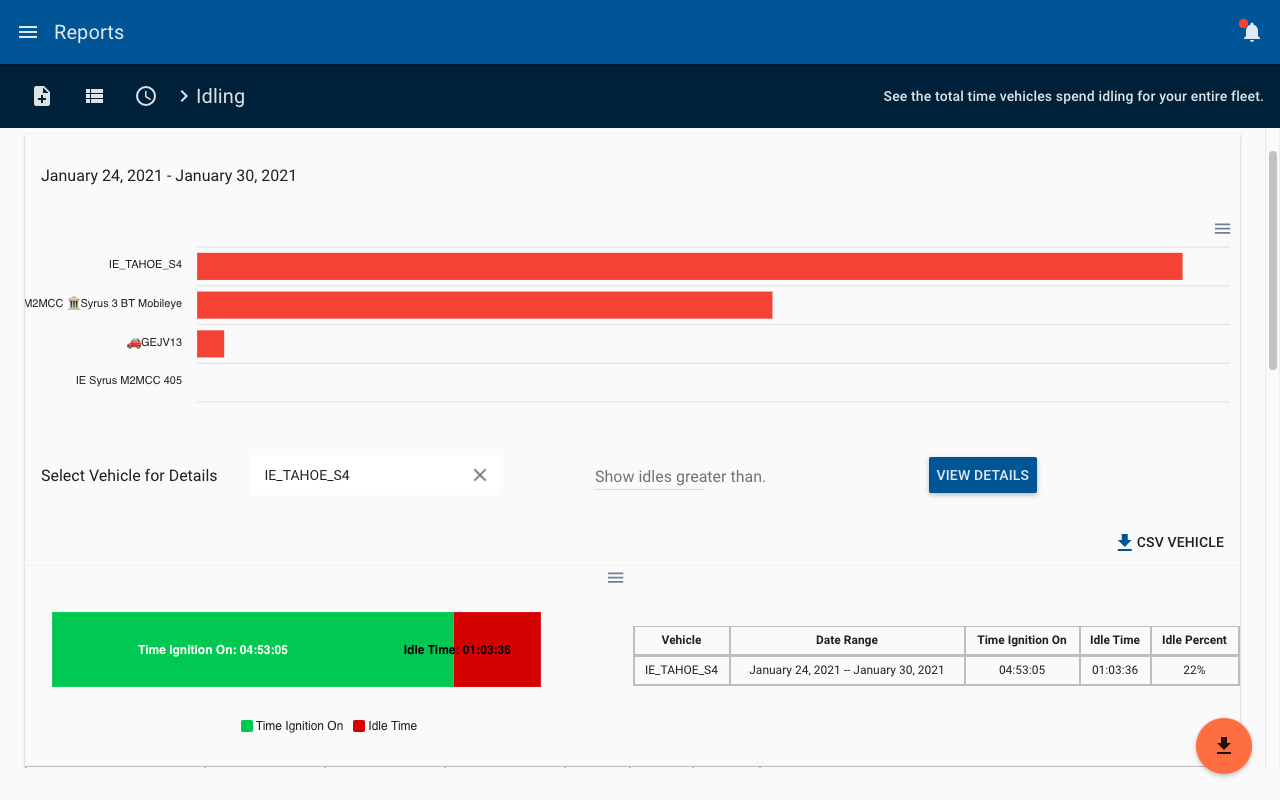
 Speeding
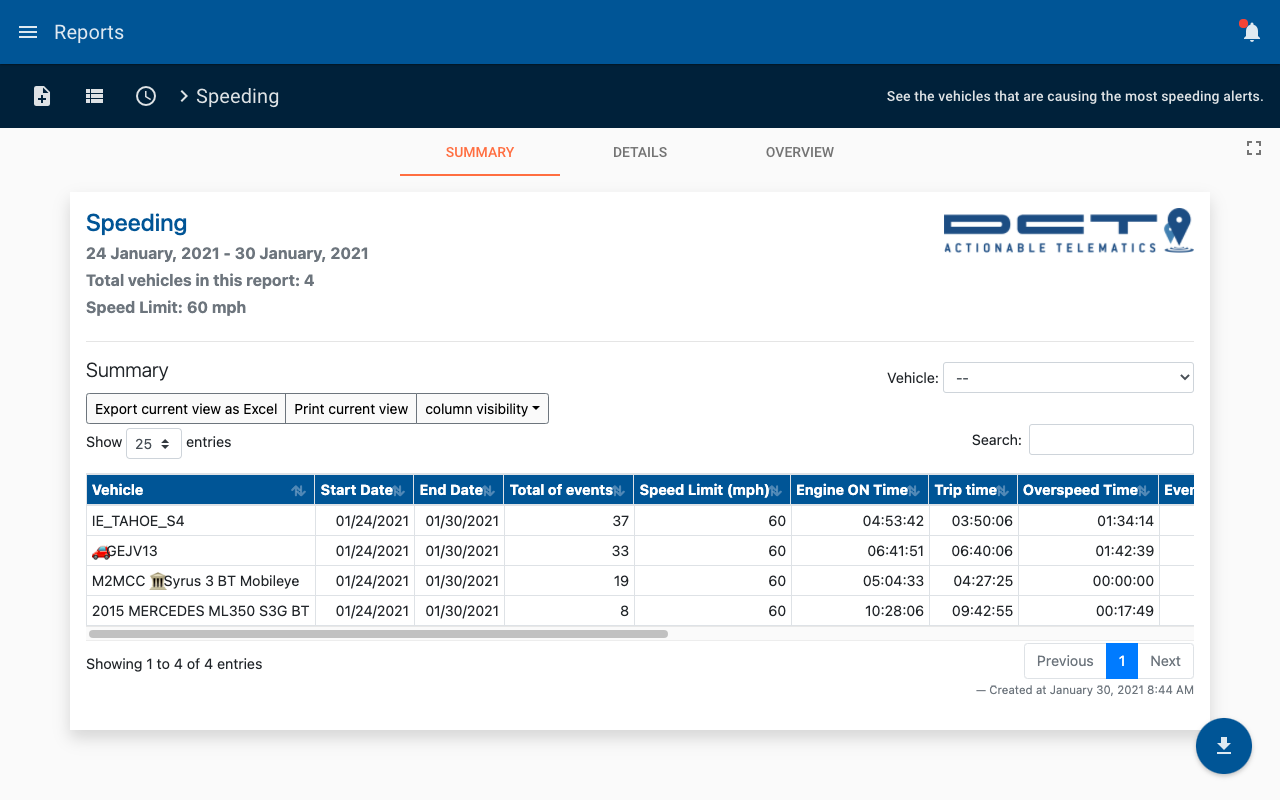
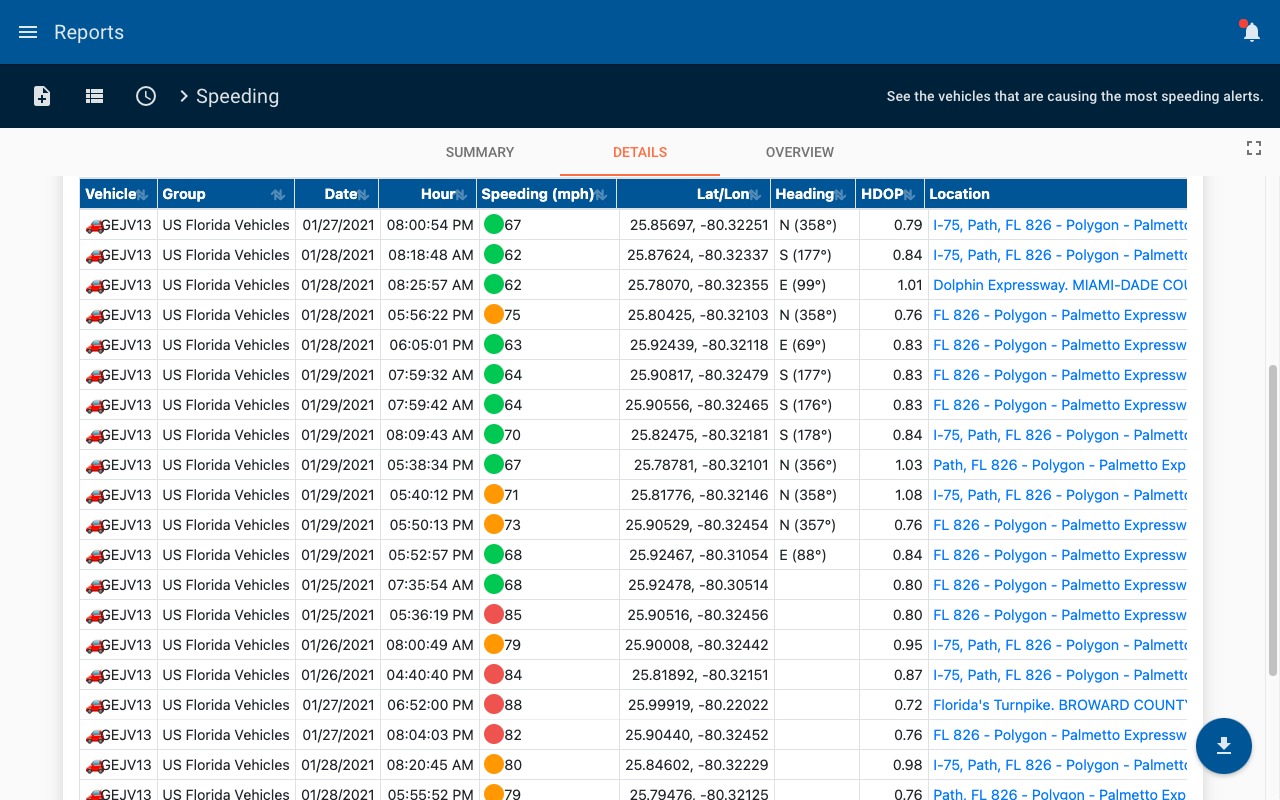

- Speeding Duration
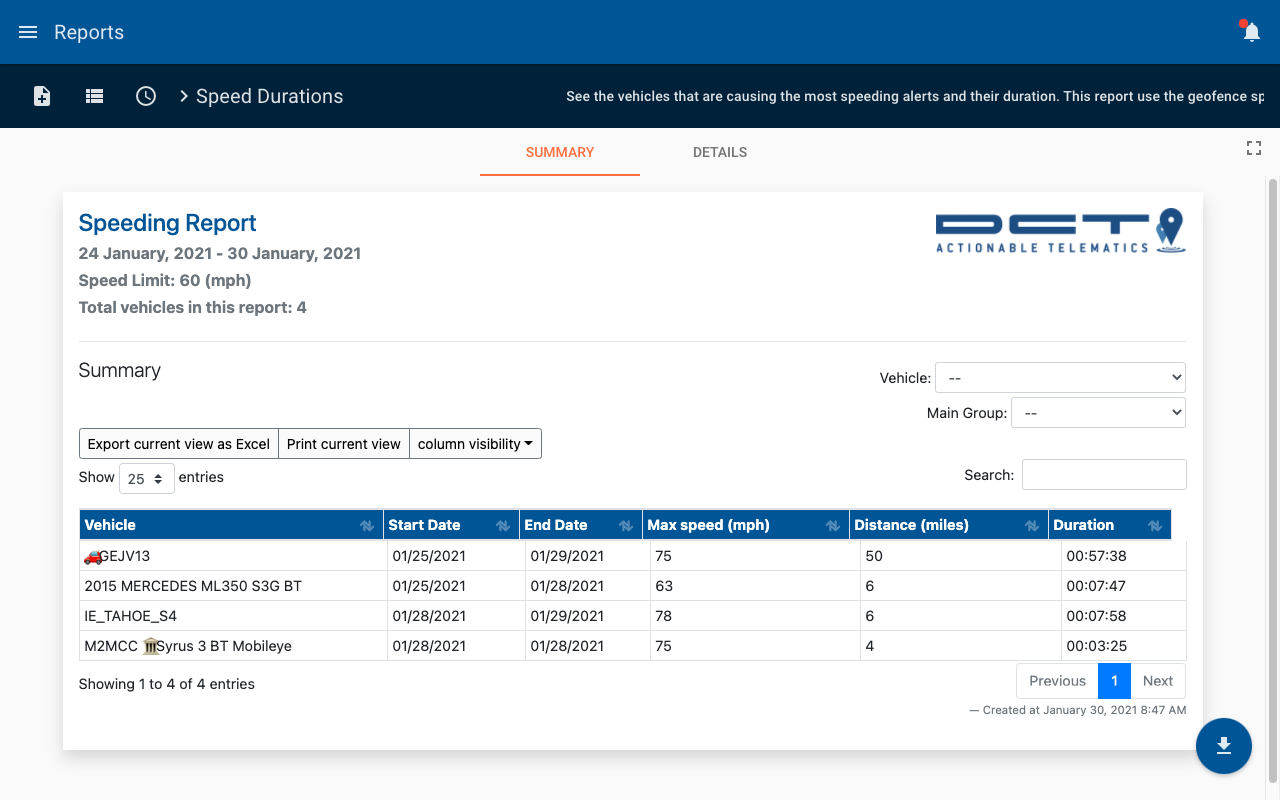

 Metrics Summary
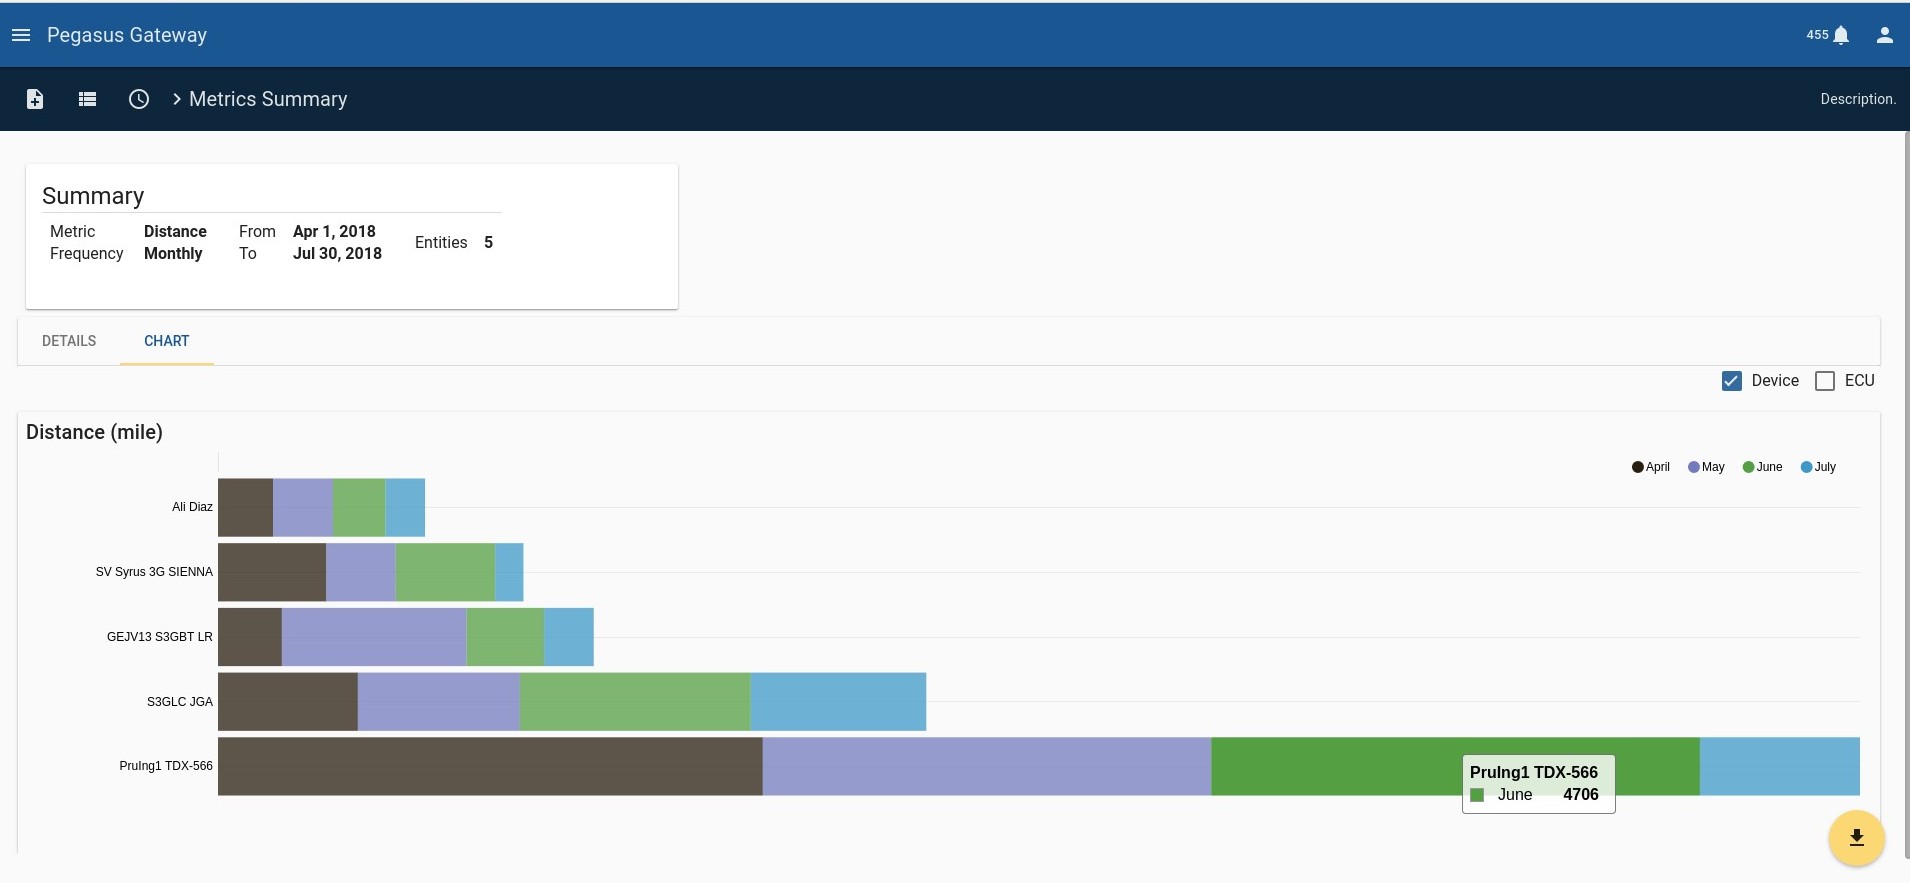
- Offline
The offline report tells you which devices in your fleet are unresponsive, this report includes information such as the battery level and last phone operator the device was connected on.
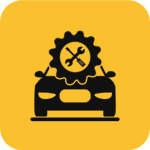 Fleet Schedule Maintenance
The fleet schedule maintenance report gives you the ability to setup your own maintenances for your vehicles and how often they’re supposed to be done. This report works best when you schedule it, giving you the ability to receive a report on a monthly basis that tells you how many miles left till your next scheduled maintenance. Please note that this report works based off of the odometer and hour meter that you enter in the Vehicle Counters section.
 Fleet Sky-View
The Fleet Sky View takes any geofence you give it and tells you if vehicles are currently in or outside of it. If you schedule this report you can receive a report at 8AM every day to know which one of your vehicles are in the geofence and which ones are not.
Features
- View all Vehicles Inside or Outside a Geofence at a specific time
- Useful when scheduled to find out if vehicles are at a location on time
- Quick and easy to use.
- Includes location of vehicles outside of the geofence
Inside
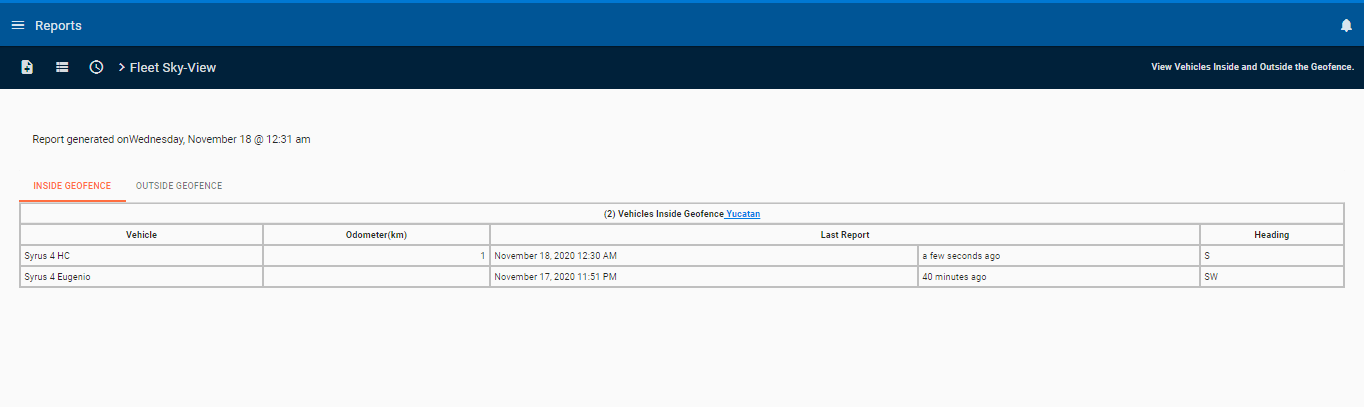
Outside
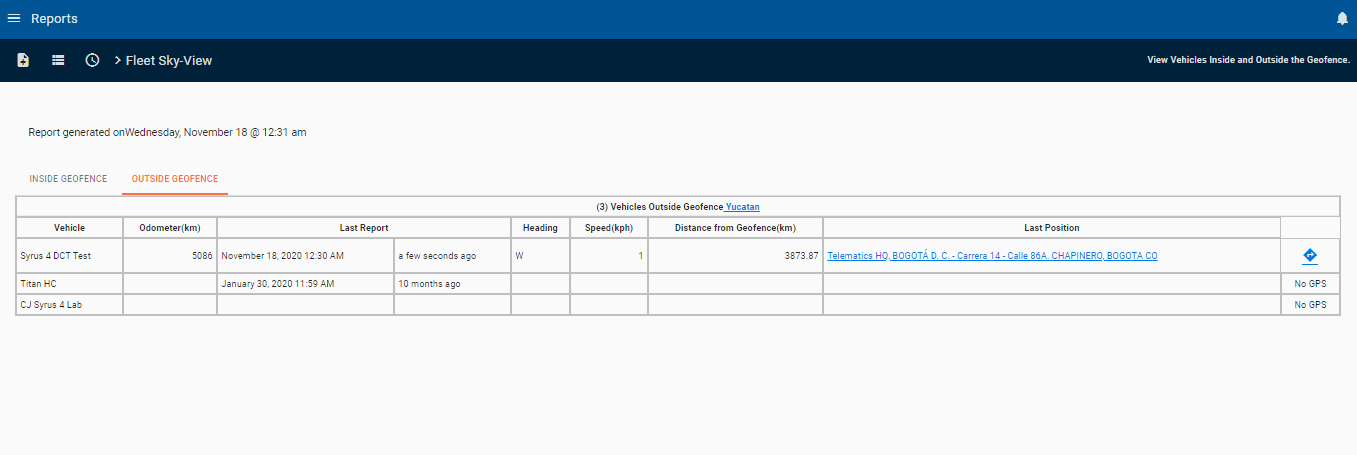
 Taurus Check In
The Taurus check-in report extends the functionality of the Taurus tracking app for your phone, and tells you all the places that you checked into, as well as the pictures captured in these places.
Features
- Analyze the time your Taurus tracker spends ON DUTY
- You can view the chat log with the app operator and the photos taken.
- You can see the log of check-ins made from the application
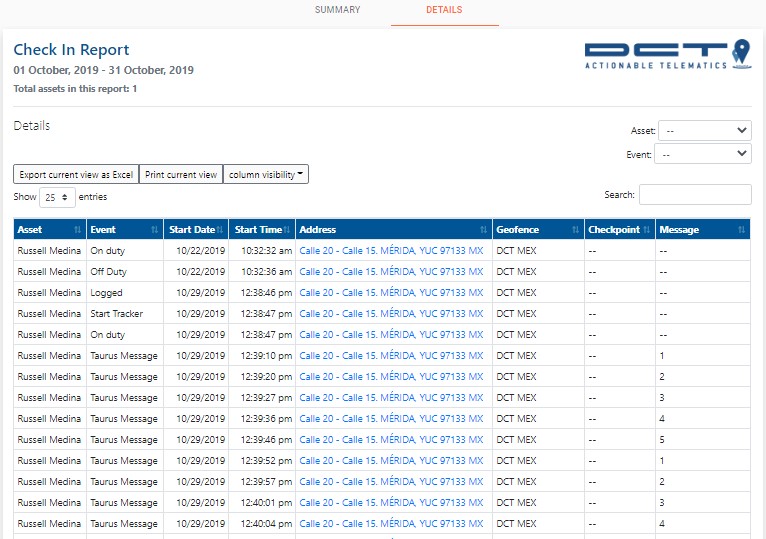
 Alerts
The alerts report includes a list of all generated trigger alerts for an entity. It allows you to filter on one specific alert so you can focus on any one incident. The report also includes which alerts were attended or not.
It is recommended to generate the report from a basic user. It is not recommended to generate the report from an admin user, especially if a large volume of alerts are generated per user
Features
- View attended and unattended alerts
- View the details of each alert generated including location information
- Displays alerts of different level like info, warning, and critical
Requirements
- The report requires a trigger with the “ALERT” action selected to be created before generating
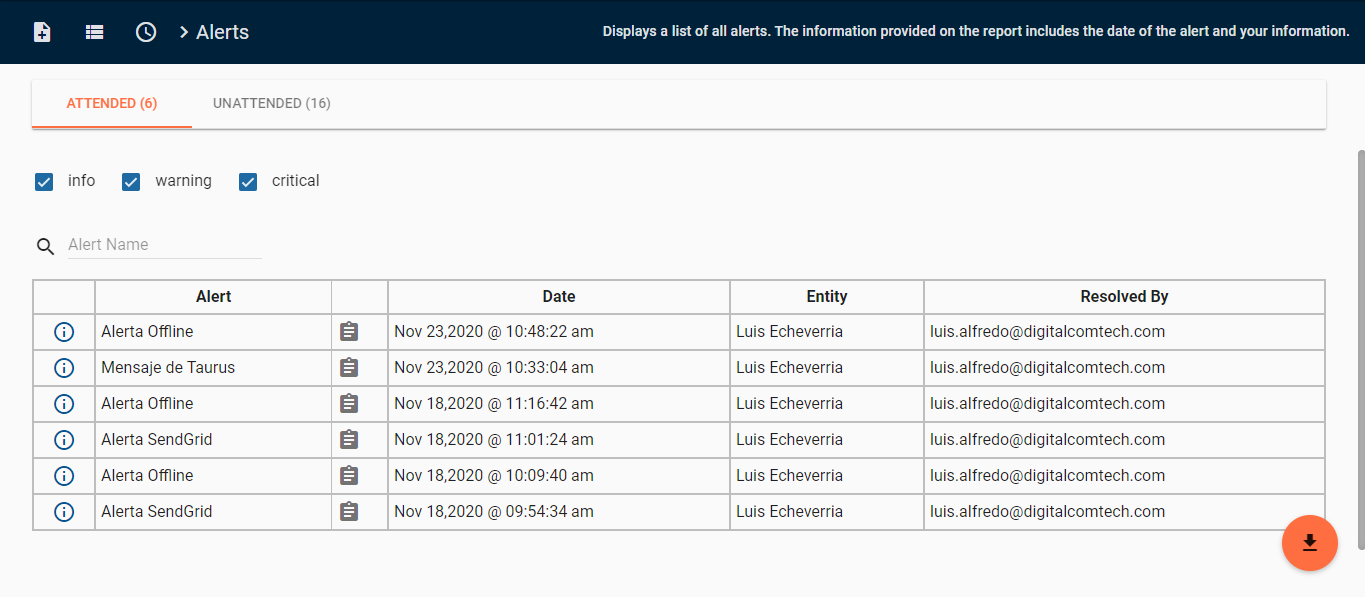
Event Analysis Reports
 Input State Duration
The input state duration report shows you the total time that a sensor was in active and inactive state.
Use this to find out how long a door was opened or how long a switch was turned ON in your fleet.
Requirements
- Works with standard device inputs
- IO-expander accessory (optional)
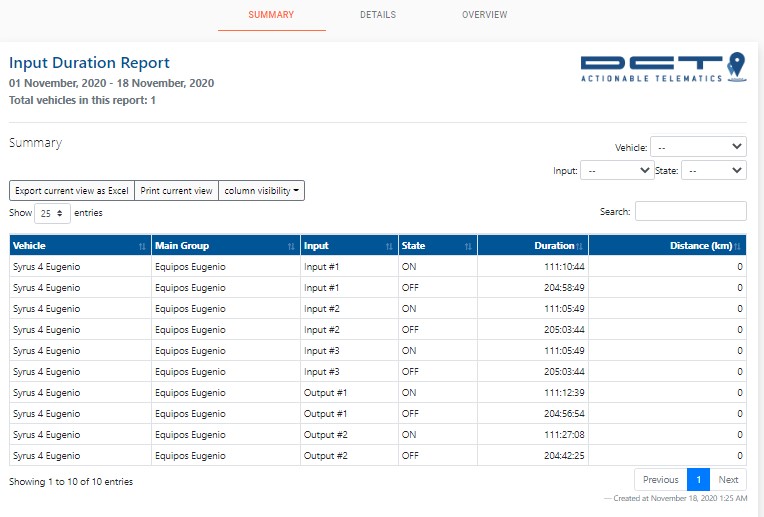
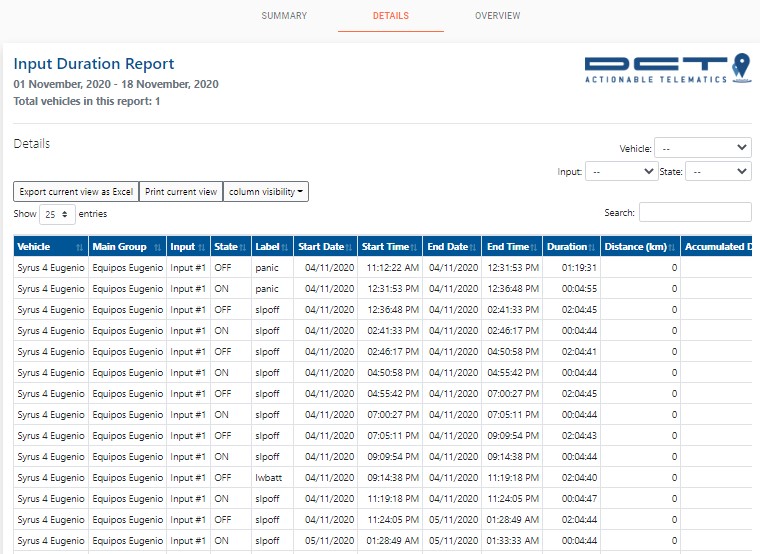
Scheduled Reports
Scheduled Reports
Scheduled reports section allows you to receive a report periodically, start by clicking on the ![]() icon on the top left side of the page.
icon on the top left side of the page.
The way that it works is that you create a scheduled report to arrive, either daily at a certain time of the day, weekly on a specific day of the week, or monthly for example.
Then you tell the system how far back do you want to get data from? In other words if I receive the report every Monday at 8AM, how far back do I want to receive data from that day. This is the “back” parameter that’s filled in when you create the report.
Create
To create a new scheduled report you’ll need to click on the create button on the bottom right, this will open a dialog where you’ll enter information about the report you want scheduled.
Please note that depending on the report that you select you’ll have some additional fields to enter which are required. For example the speeding report requires that you enter the speed limit, etc.
When you receive the email the name of the report will be sent in the Subject of the email.
Edit
Once the report is created you can click on the ![]() icon which will bring up the dialog again, and here you can edit who will receive the report.
icon which will bring up the dialog again, and here you can edit who will receive the report.
Vehicle Counters
The vehicle counters section allows you to enter values for the odometer and hour meter of your vehicle, as well as create your own customized odometers for any purpose.
To get started go to the Vehicle Counters app, under the Vehicle Management section.
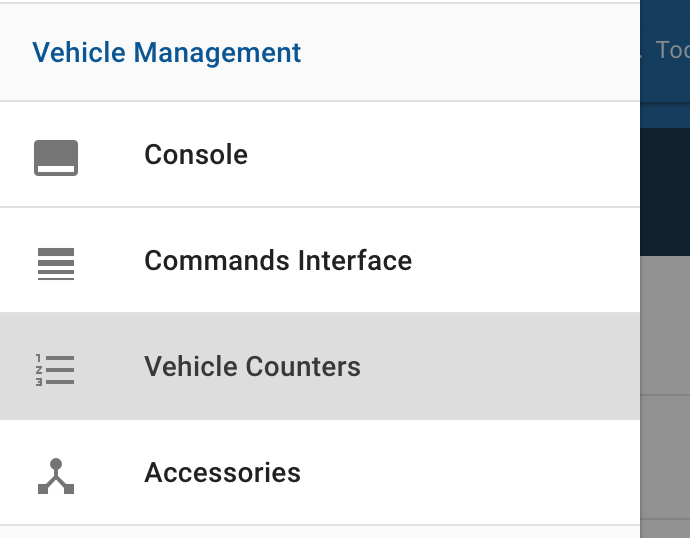
There just select a vehicle from the left hand side, and click on the Edit icon next to the “Vehicle counters” section.
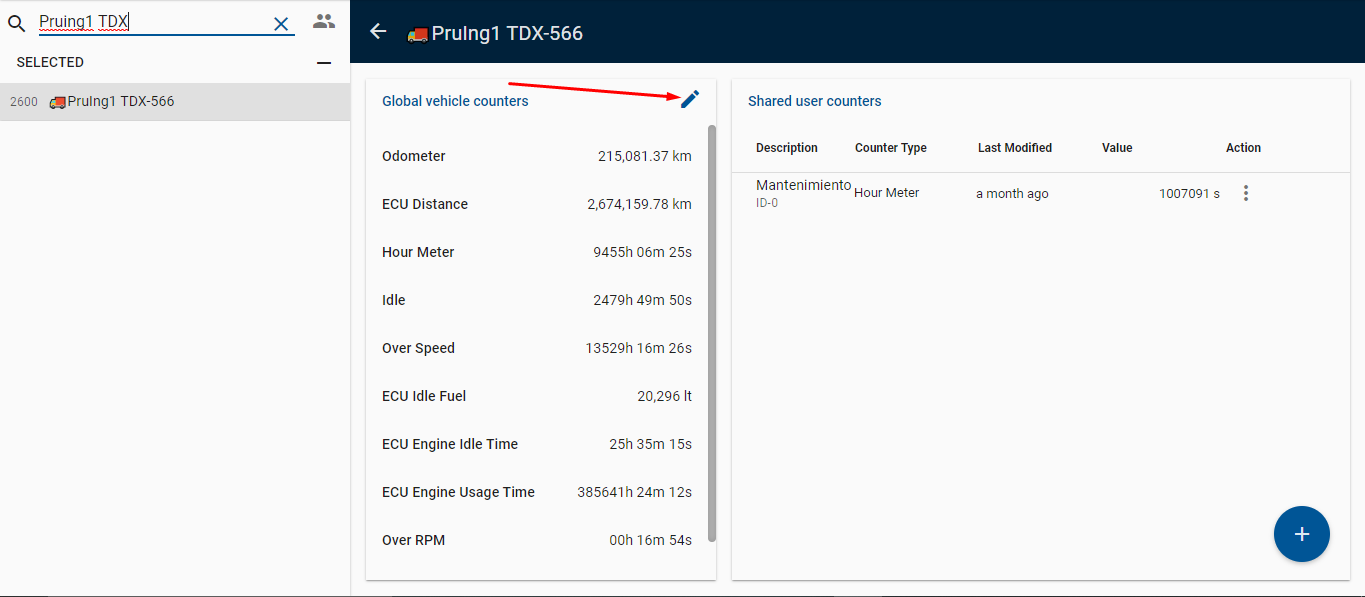
Then select the Distance counter, and enter a value in miles or km, depending on your preferences.
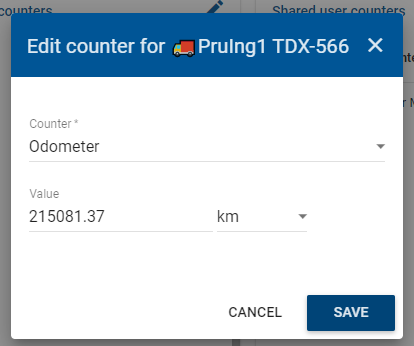
Upon saving, this will keep the value in queue waiting to be synchronized with the vehicle once the vehicle is ONLINE again.
Shared Counters
In addition to the global vehicle counters, it is possible to add counters in the Shared user counters section that will increase in the same way but may have another value. To add a counter you can click on the + symbol on the bottom right of the page. A form will appear for you to select a counter and provide a description.

Shared counters can keep track of different distances or engine hours based on a particular event in time.
You can also create these using triggers -> consume resource, take a look at the API for an example.
Mobile Applications
Syrus
Official mobile version of the application.
Download from the Google Play Store or Apple App Store:


Login with your credentials to get started and view Alerts, Trips, Tracking and Reports.
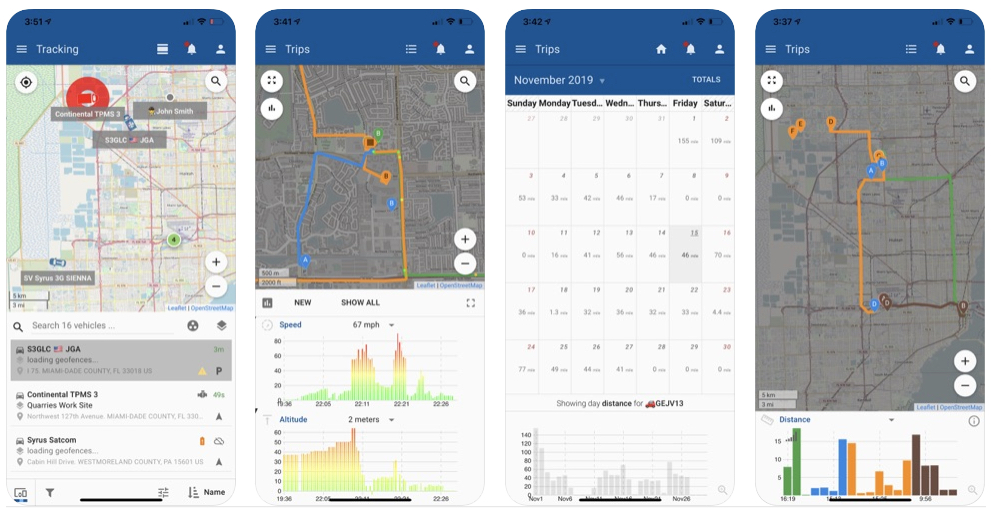
Note: Only difference with the desktop version is that you are not able to enter the administrative modules such as System or Organization.
Syrus Mobile
A lite version of Syrus application found inside the Menu (talk to your administrator if you don’t see this application enabled).
This application focuses on 5 functionalities.
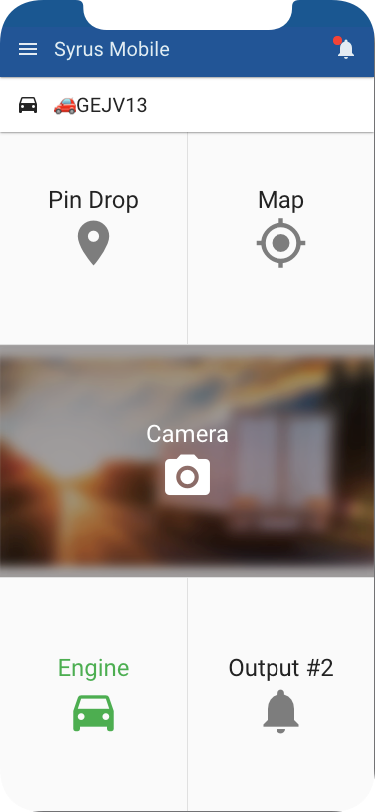
- Pin Drop – to create alerts when the vehicle exits a particular location
- Map – to view in real time the location of the vehicle
- Camera – to capture photos with the camera accessory
- Engine – to safely immobilize the engine of the vehicle (requires special installation)
- Output 2 – to activate any other peripheral remotely, could be a buzzer, alarm, siren, etc.
Taurus
Track an Android or iPhone on the gateway.
Download from the Google Play Store or Apple App Store:
![]()
Login with your unique code and start tracking your phone.
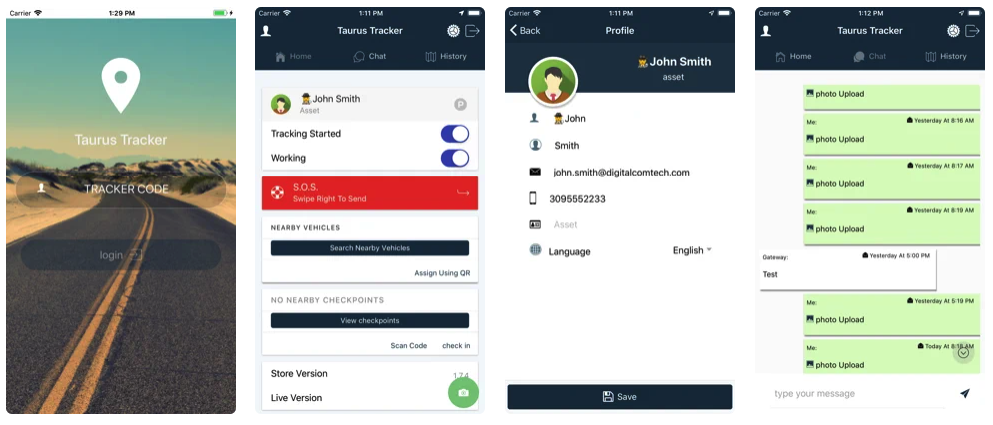
Note: Only the administrators of the site can create the code needed for you to have access.

